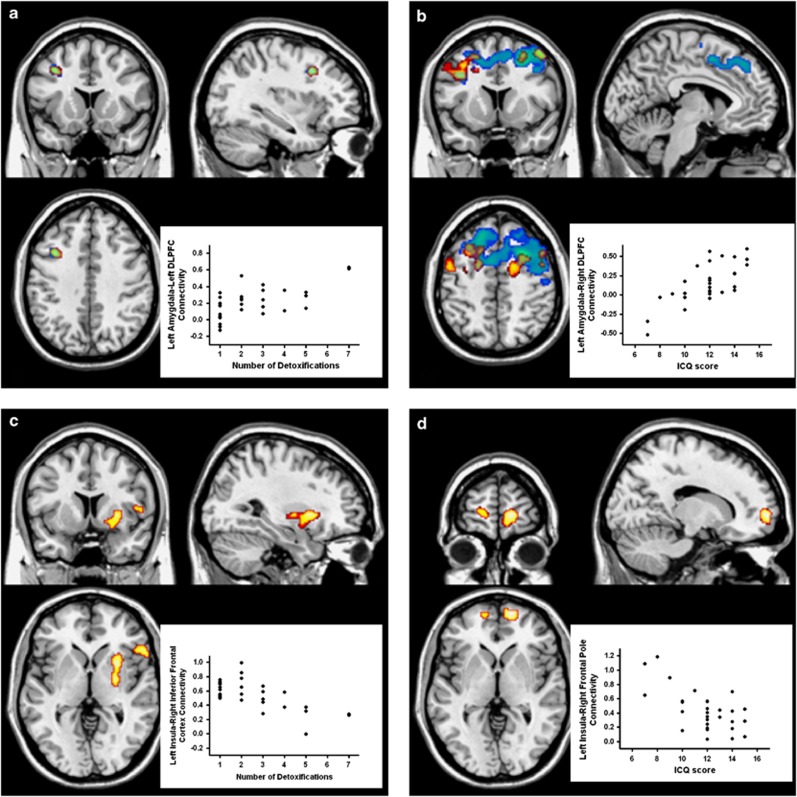
Figure 3.
Brain regions where connectivity of left (yellow) and right (blue) amygdala, and left (yellow) insula are presented. For display purposes, maps are shown at an uncorrected threshold of p<0.001. Scatterplots show the relationship between left amygdala–left dorsolateral prefrontal cortex and number of multiple detoxifications (a), left amygdala–right dorsolateral prefrontal cortex (DLLPFC) and Impaired Control Questionnaire (ICQ) scores (b) in the implicit condition, and between left insula–right inferior frontal cortex connectivity and number of multiple detoxifications (c), as well as between left insula–right frontal pole and ICQ scores (d) in the explicit condition.

