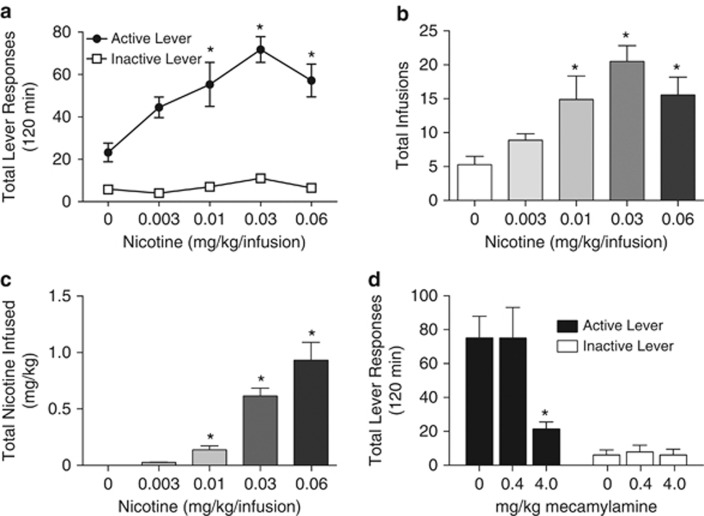
Figure 1.
Nicotine dose-response curve and attenuation of nicotine self-administration following systemic administration of the nicotinic acetylcholine receptor antagonist mecamylamine. Data in panel (a) depict the total number of responses (mean±SEM) on the active and inactive levers for each unit dose of nicotine self-administered (n=9 per treatment). The asterisks denotes a significant difference in active lever responding between animals self-administering 0.01, 0.03, or 0.06 mg/kg/infusion of nicotine when compared with saline (Tukey's HSD, p<0.05). Dose-response curves for total infusions (b) and total nicotine infused (c) are also displayed for increasing unit doses of nicotine. Data are presented as mean±SEM. Asterisks denote significant differences in total infusions and total nicotine infused during the daily 2-h operant session between animals self-administering 0.01, 0.03, or 0.06 mg/kg/infusion of nicotine vs saline (n=9 per treatment). (d) Total number of responses (mean±SEM) on the active and inactive levers in animals self-administering nicotine following pretreatment with saline, 0.4, and 4.0 mg/kg mecamylamine (n=7 per treatment). The asterisk denotes a significant difference on active lever responding between 4.0 mg/kg mecamylamine and saline and 0.4 mg/kg mecamylamine treatments (Tukey's HSD, p<0.05). No significant differences in responding on the inactive lever (mean±SEM) were found between treatments.

