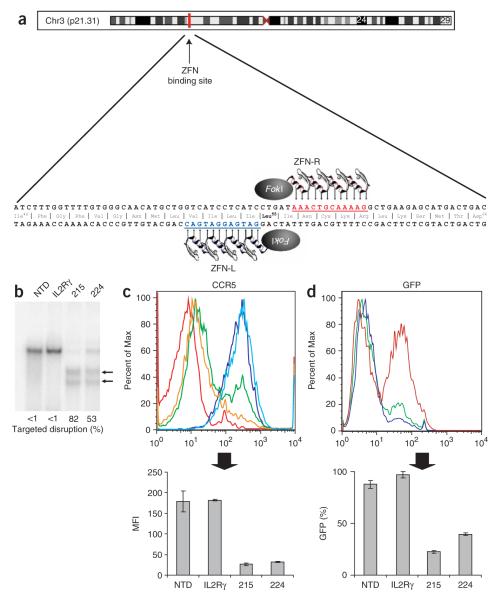
Figure 1.
ZFN-mediated disruption of CCR5 and protection from HIV-1 infection in GHOST-CCR5 cells. (a) Schematic of the CCR5 coding region showing the genomic DNA sequences targeted by CCR5 ZFNs 215/224. (b) Level of targeted gene disruption in GHOST-CCR5 cells transduced with an Ad5/35 vector encoding ZFNs targeting either CCR5 or IL-2Rγ as assessed by the Surveyor assay (Supplementary Fig. 2). Lower migrating products (arrows) are a direct measure of ZFN-mediated gene disruption. NTD, nontransduced cells. (c) Decreased CCR5 surface expression measured by flow cytometry (light blue, IL2Rγ ZFN; green CCR5 ZFN-224; orange, CCR5 ZFN-215; dark blue, nontransduced cells; red, unstained cells). (d) Protection from HIV-1BAL measured by flow cytometry 48 h after HIV-1 challenge of CCR5 ZFN-215 and CCR5 ZFN-224-modified cells compared to IL2Rγ ZFN and control GHOST-CCR5 cells (red, IL2Rγ ZFN; green, CCR5 ZFN-224; blue, CCR5 ZFN-215). GFP fluorescence indicates HIV-1 entry and is plotted as average percent infected relative to positive control. MFI, mean fluorescence intensity. Histograms of CCR5 (c) and GFP expression (d) show one replicate for each condition; bar graphs below represent averages (±s.d.) of triplicates. Expression of CCR5 and HIV-1 infection frequency of CCR5 ZFN-treated cells is less than IL2Rγ ZFN or nontransduced cells (P < 0.001).

