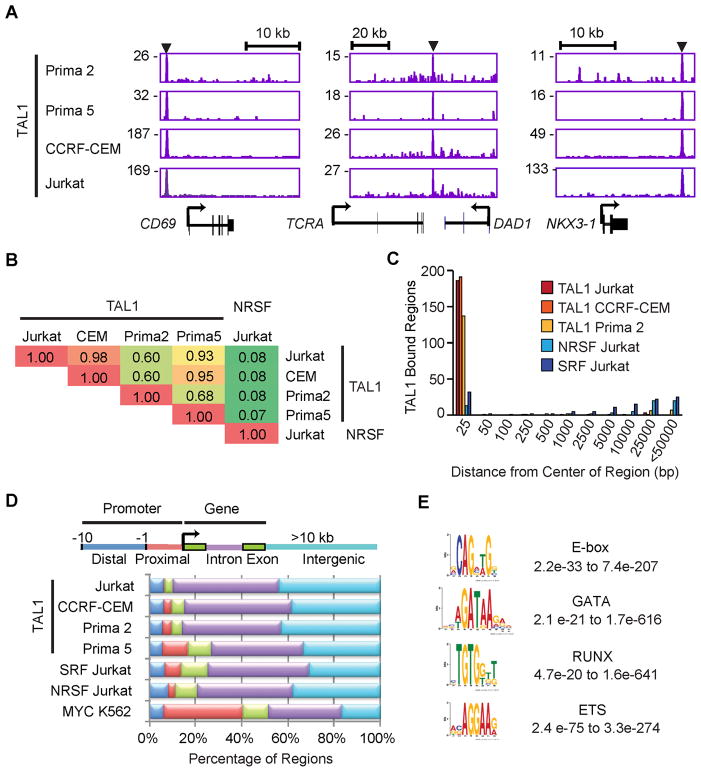
Figure 1. TAL1 occupancy is highly consistent across T-ALL cell lines and primagraft samples.
(A) Gene tracks represent binding of TAL1 in T-ALL primagrafts (Prima 2 and Prima 5) and cell lines (CCRF-CEM and Jurkat) at the CD69, TCRA and NKX3-1 loci. The x-axis indicates the linear sequence of genomic DNA, and the y-axis the total number of mapped reads. The black horizontal bar above each gene example indicates the genomic scale in kilobases (kb). Black boxes in the gene map represent exons, and arrows indicate the location and direction of the transcriptional start site. Arrowheads denote regions bound by TAL1. (B) Pairwise comparison of the TAL1-bound regions found in T-ALL primagrafts and cell lines. Fractions of the top 200 TAL1-bound regions in each cell type (rows) that were occupied by TAL1 in the other cell types (columns) are shown as a matrix. Regions occupied by the unrelated transcription factor NRSF in Jurkat served as a negative control. (C) Distances from the center of the TAL1-bound region (top 200) in Prima 5 to the center of the nearest bound region of the indicated transcription factors were determined and grouped into bins (x-axis); the heights of bars represent the sum of the bound regions in each bin (y-axis). (D) Each region bound by TAL1 was mapped to the closest Refseq gene: distal (blue) and proximal (red) promoters, exon (green), intron (violet) and intergenic regions (light blue) more than 10 kb from the gene. (E) The representative position weight matrix for each motif enriched in TAL1 by ChIP-seq and the range of E-values found across different T-ALL cell types are shown. See also Figure S1 and Table S1.

