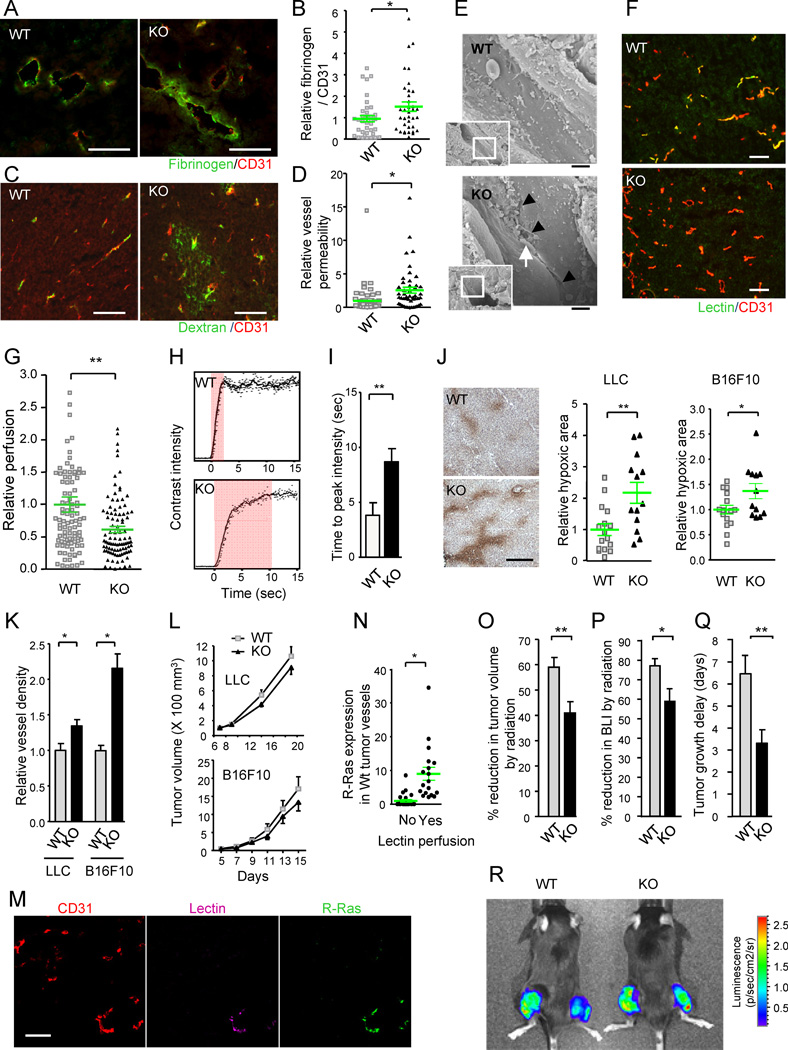
Figure 3. R-Ras deficiency diminishes tumor vessel function.
(A–D) Analyses of vessel leakiness. Fibrinogen and CD31 staining for plasma leakage in B16F10 tumors (A). To quantify the level of plasma leakage and standardize it for tumor vessel area, the ratio of fibrinogen (fibrin)-stained area to CD31 area was determined and is presented as relative values (B). *p = 0.035, ±SEM. Dextran-FITC was injected i.v. into mice bearing LLC tumors (C). The fluorescence intensity of extravasated FITC in the tumors was standardized for the perfused vessel counts to assess vessel permeability (D). *p = 0.002 (E) Ultrastructure of tumor vessels by scanning electron microscopy. The R-Ras KO tumor endothelium shows significant special gaps at the cell-cell junctions (arrowheads). Arrow, a red blood cell extravasating between the cellular gap. Scale bar, 2 µm. (F and G) Blood perfusion efficiency. Lectin perfusion and CD31 staining of B16F10 tumor sections (F). Yellow color indicates double-stained vessel area. Percent lectin+CD31+ double-positive area/total CD31+ area was determined to assess perfusion efficiency of tumor vasculature (G). **p = 2×10⁻⁴ (H and I) Study of tumor vessel perfusion by contrast-enhanced ultrasound imaging. Examples of raw contrast kinetics acquired after bolus i.v. injection of microbubble contrast agent (H). Delayed time-to-peak-intensity in KO mice indicating poor perfusion efficiency (I). **p = 0.02 (J) Analysis of tumor hypoxia. The ratio of the hypoxic area/total area of the tumor section was determined and presented as relative values. Representative anti-Hypoxyprobe staining of LLC tumors is shown. *p = 0.03, **p = 0.003 (K) Number of tumor vessels per unit area (vessel density) is presented relative to the control group. *p < 0.05 (L) Growth of LLC and B16F10 tumors. (M and N) Analysis of R-Ras expression in wild type vessels. Sections of lectin-perfused tumors were stained for CD31, lectin, and R-Ras (M). The tumor vessels were classified as lectin-perfused and non-perfused vessels, and the level of R-Ras expression was determined for individual vessels in each group (N). *p = 7×10⁻⁴ (O–R) Effect of radiotherapy. (O) The percent reduction in the tumor volume (as compared with untreated tumors) was determined at 7 days after a local 12 Gy irradiation of LLC tumors (O). **p < 0.01 (P) Percent inhibition of tumor growth was also assessed by bioluminescence tumor imaging at day 7. BLI, bioluminescence intensity. *p = 0.02 (Q) Tumor growth delay as defined by delay in tumor volume quadrupling time as a result of irradiation treatment. The average delay time (in days) is presented. **p < 0.01 (R) Bioluminescence imaging of Luc2-transfected LLC tumors. Tumors on the right thigh received 12Gy irradiation whereas tumors on the left did not. WT, wild type; KO, R-Ras KO mice. Scale bars, 100 µm (A, C, F, M), 200 µm (J). See also Figure S2 and Table S1.

