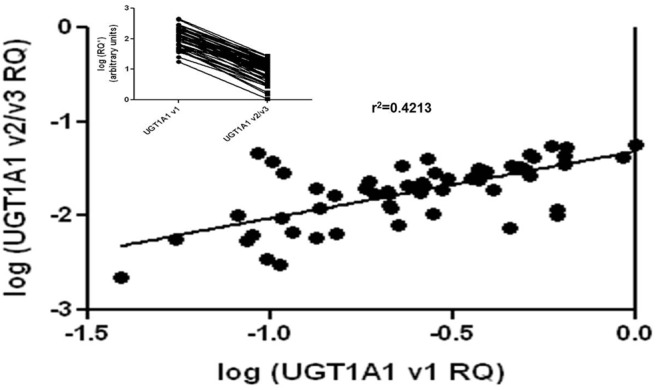
Fig. 5.

Relative expression levels of UGT1A1 v1 and UGT1A1 v2/v3 mRNAs in 58 human liver specimens. The nested qPCR developed in this study was used to determine the relative expression of UGT1A1 v1 and UGT1A1 v2/v3 in total RNA isolated from the liver specimens described under Materials and Methods. Shown is the correlation between the expression of the v1 and v2/v3 variants in the 58 individual liver specimens. Inset, lines connect the UGT1A1 v1 RQ value of an individual specimen with the corresponding UGT1A1 v2/v3 RQ value from the same specimen.
