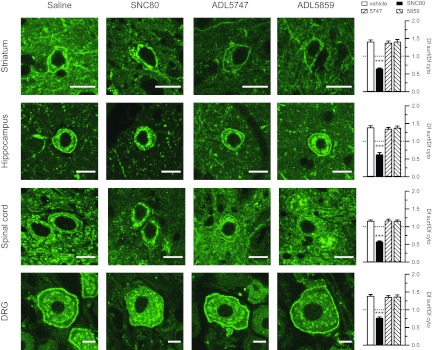
Fig. 8.
Confocal imaging of SNC80-, ADL5747-, and ADL5859-induced δ-receptor redistribution in DOR-eGFP mice. All mice were perfused 45 min after the drug administration. Confocal images were taken at striatum, hippocampus, spinal cord, and dorsal root ganglia. Bars on each image indicates the length of 10 μm. Ratio of mean fluorescence density on cell surface (Df surf) and cytoplasm (Df cyto) was defined by total fluorescence intensity of cell surface or cytoplasm. Data are expressed as means ± S.E.M. of four mice per group for each region or tissue. Empty bars, control group; filled bars, SNC80 group; left striped bars, ADL5747; right striped bars, ADL5859. Data were first averaged for each brain region or tissue for each mouse, and statistical comparison was performed between the four experimental groups. A significant effect of δ agonist versus vehicle control is indicated: ***, P < 0.001, drug-treated group versus vehicle-treated group (one-way ANOVA followed by Bonferroni post hoc test).

