Fig. 4.
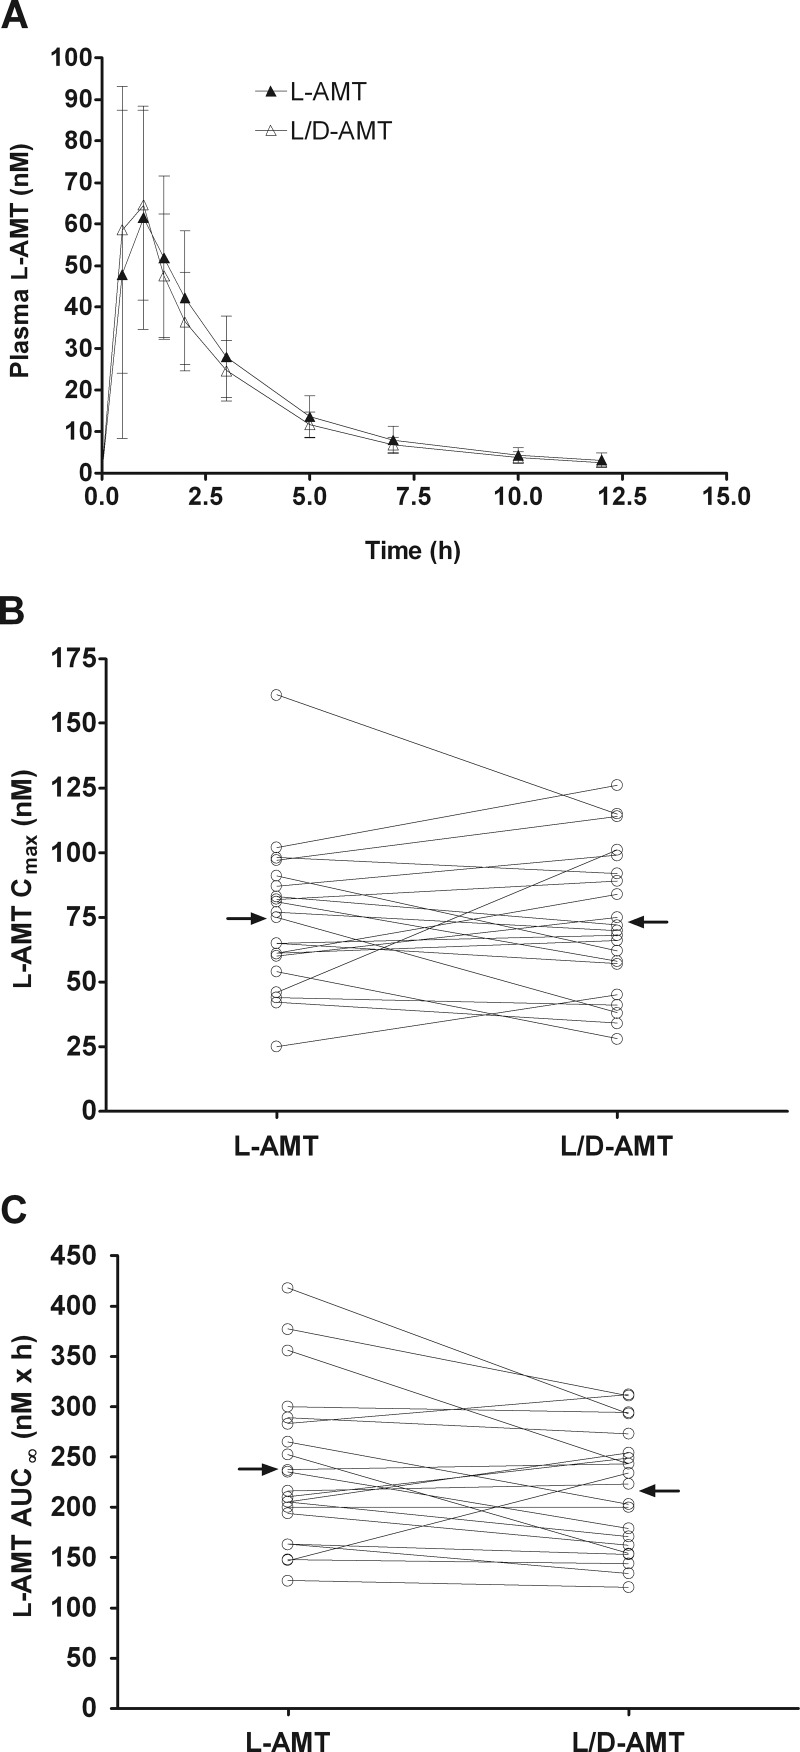
Bioequivalence of l-AMT and l/d-AMT in psoriatic subjects (n = 21) after single-dose oral administration of l-AMT (0.7 mg of l-enantiomer) and l/d-AMT (0.7 mg of l-enantiomer and 0.3 mg of d-enantiomer) in a phase 1, two-arm randomized, open-label, two-period crossover trial. Plasma samples were collected over a 12-h period and analyzed by LC-MS/MS as described under Materials and Methods. Pharmacokinetic parameters were derived from concentration versus time profiles. There was no detectable d-enantiomer in the plasma after dosing of either drug product; values shown are only for the l-enantiomer in plasma. A, plasma concentration-time profiles for l-AMT and l/d-AMT, where each concentration value shown is the mean ± S.D. B and C, the pharmacokinetic parameters Cmax (B) and AUC∞ (C) derived for plasma l-AMT are shown as a function of administered l-AMT and l/d-AMT. Lines connect data points for the same subject, and horizontal arrows point to the group mean. The Cmax and AUC∞ for l-AMT and l/d-AMT were bioequivalent (i.e., the 90% CI of the Cmax and AUC∞ ratios for l-AMT and l/d-AMT within 0.8–1.25).

