
Fig A1.
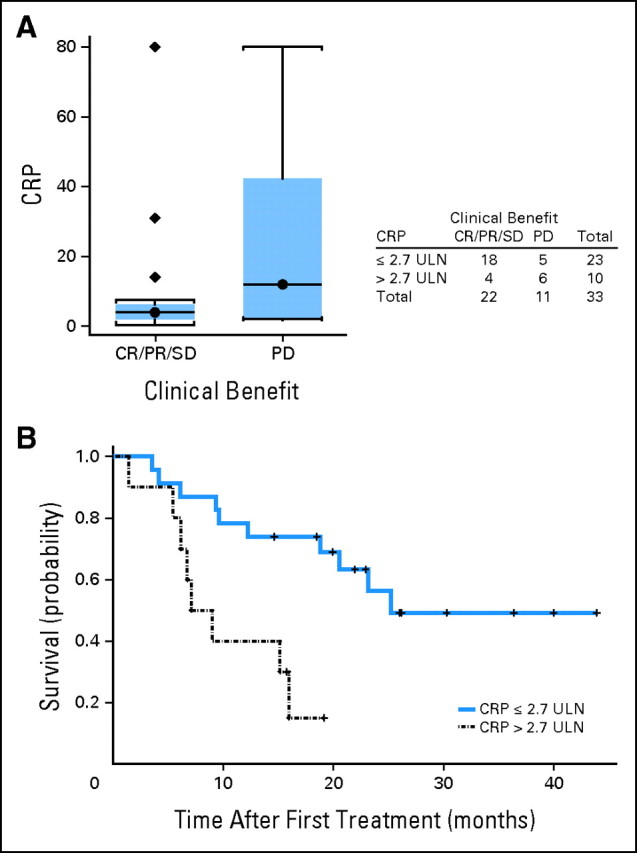
(A) Distribution of baseline C-reactive protein (CRP) by clinical benefit (complete response [CR]/partial response [PR]/stable disease [SD] v progression of disease [PD]) and (B) the probability of survival (CRP, ≤ 2.7× v > 2.7× the upper limit of normal [ULN]).