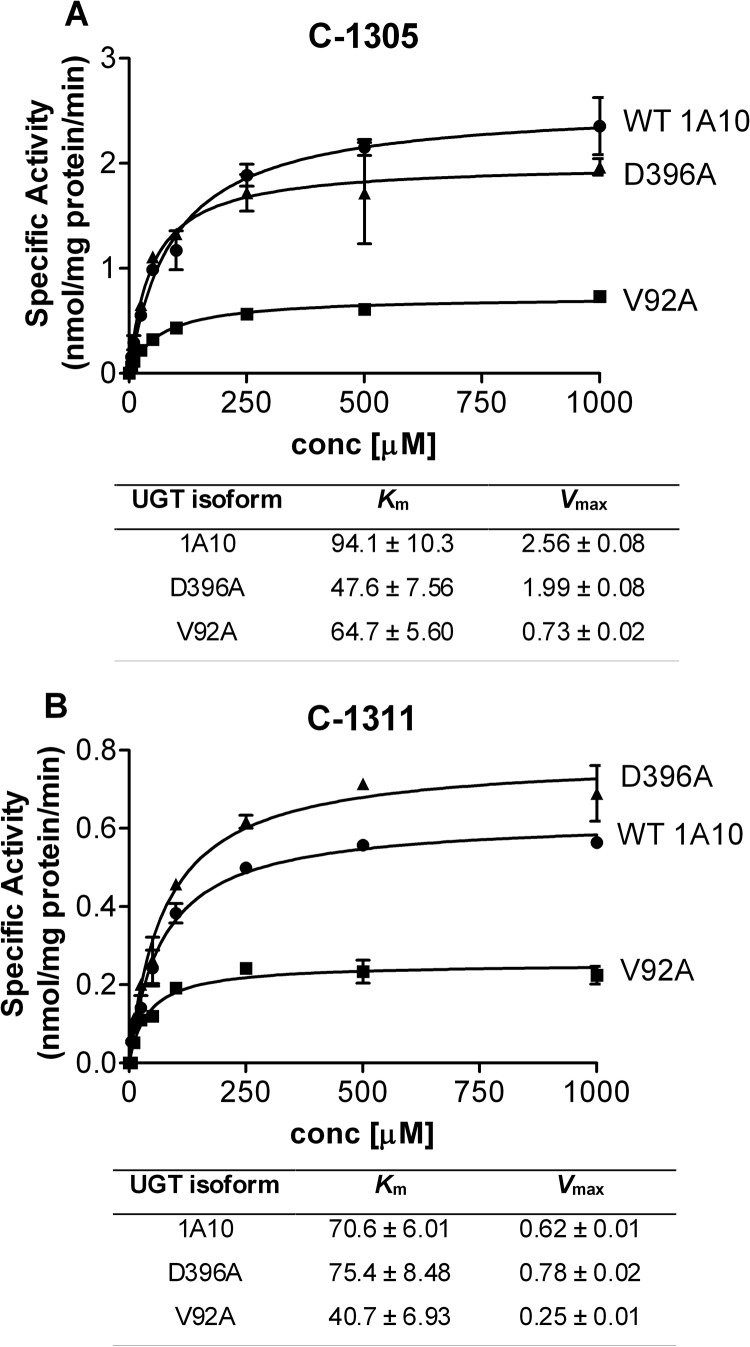
Fig. 8.
Kinetic constants for C-1305 (A) and C-1311 (B) glucuronidation by recombinant WT UGT1A10 and mutants. Glucuronidation activities of recombinant WT UGT1A10 (●) and the D396A (▴) and V92A (■) mutants were measured by incubating membrane fractions containing recombinant UGT1A10 and its mutants (5 μg) with increasing concentrations (shown in the figure) of the substrates at a constant concentration of UDP-GlcUA (3 mM) for 60 min at 37°C. Curve fits and kinetic constants were determined using GraphPad Prism 4 software (GraphPad Software Inc.). The graphical fits of the data from each of the analyses with each substrate (mean ± S.D. of three determinations) are shown. Km values are given in μM, and Vmax values are given in nmol/mg protein/min.

