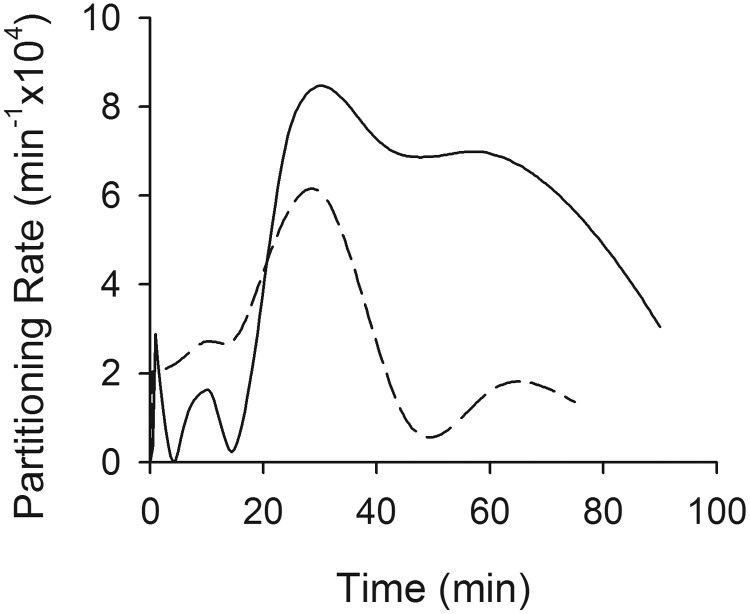
Fig. 5.
Results of deconvolving Cbrain/Cserum versus time data in ER-interrupted rats from control animals. The solid line indicates Mrp2-deficient/control Wistar rats; the dashed line indicates antibiotic-treated/control Sprague-Dawley rats. The deconvolved partitioning rate is the rate of change in the Cbrain/Cserum ratio. The area under the partitioning rate versus time profile is a unitless number that serves as a metric of the degree of overshoot and was 7.95 × 10⁻⁴ for Mrp2-deficient/control Wistar rats and 3.38 × 10⁻⁴ for antibiotic-treated/control Sprague-Dawley rats.

