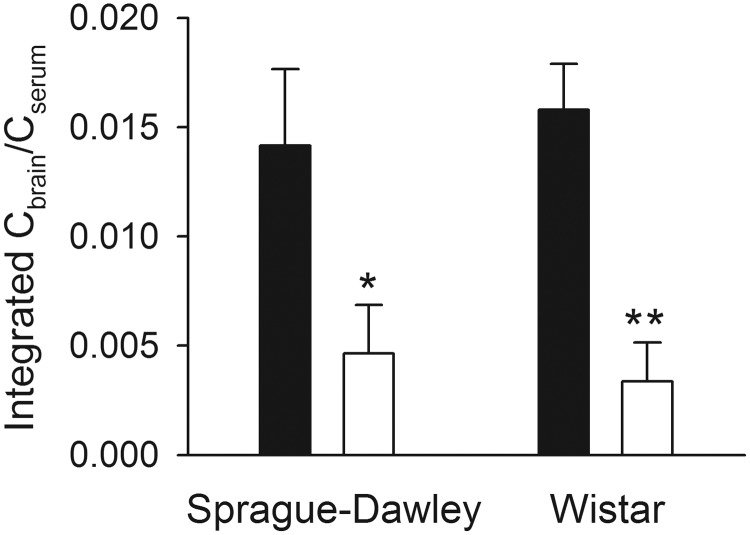
Fig. 6.
Area under the Cbrain/Cserum versus time profile normalized for sampling duration (eq. 2) after a 100 mg/kg bolus dose of VPA. Filled bars indicate ER-competent control (vehicle-treated Sprague-Dawley and vehicle-treated wild-type Wistar) rats, and open bars indicate ER-interrupted (antibiotic-treated Sprague-Dawley and Mrp2-deficient Wistar) rats. Error bars indicate S.D.; asterisks indicate statistically significant difference within each strain (P < 0.001).

