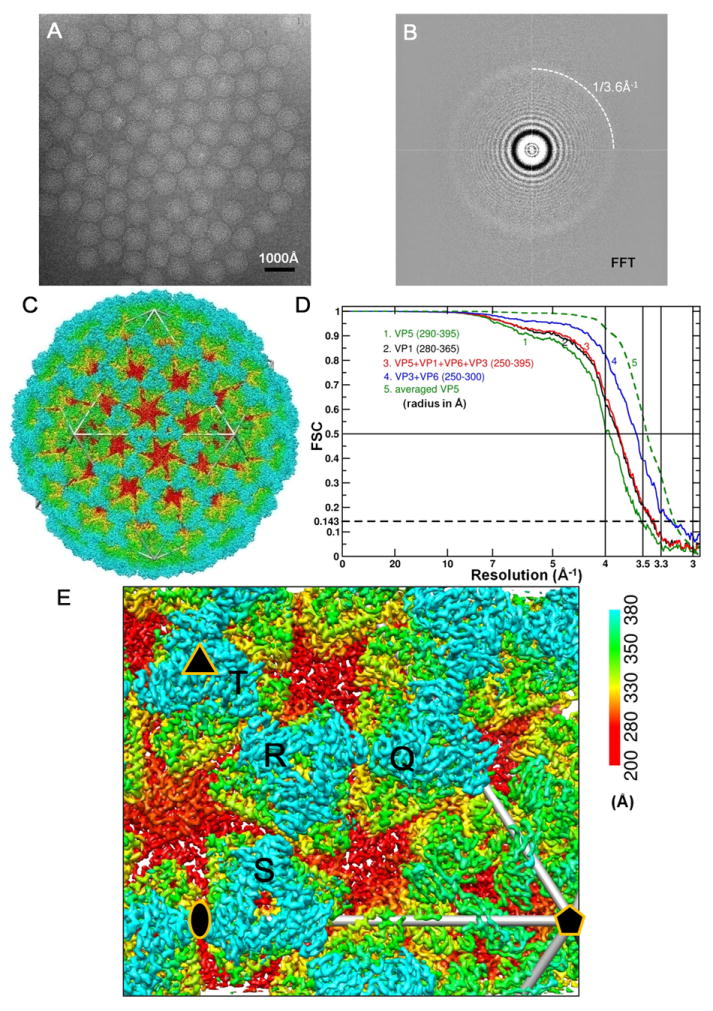
Figure 1. Cryo-EM and 3D Reconstruction of Infectious Subvirion Particle of Aquareovirus.

(A) Representative cryo-EM image of the ISVP at 1.2 μm underdefocus. There is no carbon support film, and viral particles are suspended in vitreous ice.
(B) Fourier-transformed spectrum of the image in (A), showing contrast transfer function rings visible beyond 1/4 Å-1 and a strong signal at ~1/3.6 Å-1 (dashed arc), which is likely due to H2O (Dowell and Rinfret, 1960).
(C) Density map of the aquareovirus ISVP at 3.3 Å resolution, colored according to radius. An enlarged view of an asymmetric unit is shown in Figure 1E. See also Movie S1.
(D) Fourier shell cross-correlation coefficients (FSC), indicating the effective resolution to be 3.3 Å for VP3, VP6 and the averaged VP5, and 3.5 Å for VP1 according to the reference-based criterion as defined by Rosenthal and Henderson (Cref=0.5 or FSC=0.143) (Rosenthal and Henderson, 2003). Different curves represent different protein shells: the whole protein shell (red), the shell containing VP1 (black), the shell of VP3 and VP6 (blue) and the VP5 layer (green: the solid line for the original VP5 layer and the dashed line for the averaged VP5).
(E) Enlarged view of the cryo-EM density of the primed ISVP, showing an asymmetric unit in Figure1C. Four pseudo equivalent VP5 trimers are labeled (Q, R, S and T), and positions of 2- (ellipse), 3- (triangle) and 5-fold (pentagon) axes are indicated. See also Figure S1 and Movie S1.
