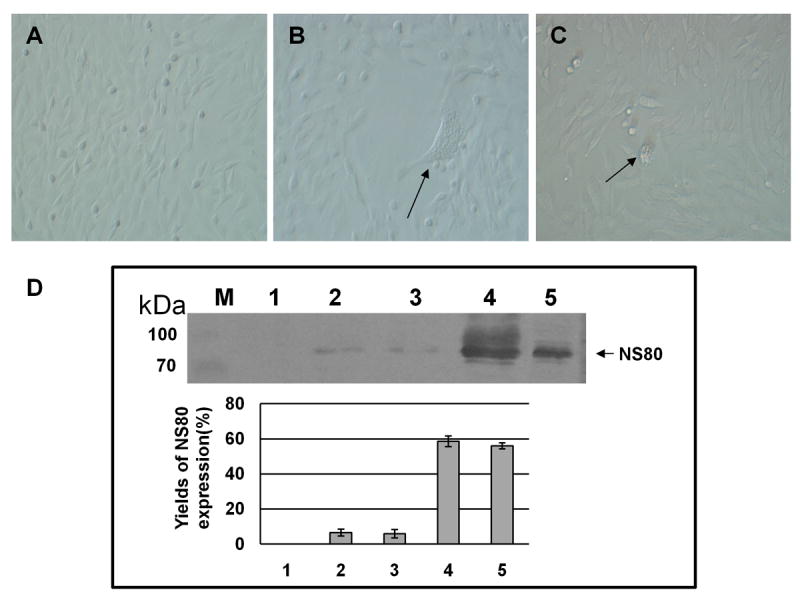
Figure 6. Infection and Replication of Aquareovirus at 4°C.

(A) Mock infected CIK.
(B) and (C) aquareovirus infected CIK cell at 4°C and 3 days post infection. Arrows indicate the cytopathic effects (CPE) in infected cells.
(D) Immunoblot analysis of viral NS80 expression. Lane (M), Molecular weight markers; Lane 1, Mock infected CIK cell lysate showing the NS80 protein expression level of 0% as negative control (measured by relative optical density: 0%, no absorbance; 100%, complete absorbance); Lanes 2 and 3, aquareovirus infected CIK cell lysate at 4°C showing the NS80 protein expression levels of 6.6% and 5.8% at 5 days post infection; Lane 4, aquareovirus infected CIK cell lysate at 28°C showing the NS80 protein expression level of 58.7% at 2 days post infection; Lane 5, E. coli expressed NS80 at level of 56% as positive control. Experiments were performed in triplets, and the mean optical density of the triplet immunoblots were shown (error bars represent standard deviation).
