Figure 5.
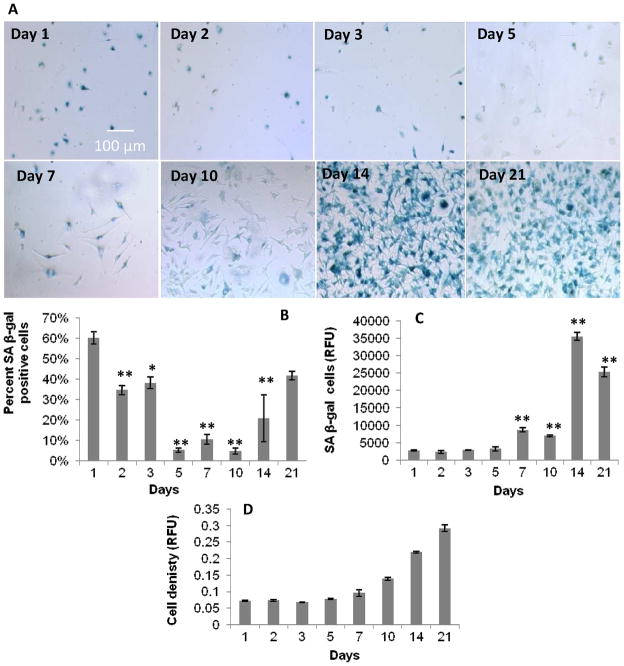
Proliferative capacity of primary BMMΦs over 21 days in culture in the presence of continual LPS stimulation. A) Color images of SA beta-gal staining in primary BMMΦs over 21 days in the presence of LPS. Graphical representation of: B) percent SA beta-gal positive cells from the colorimetric SA beta-gal assay, C) relative fluorescence from the fluorescent SA beta-gal assay, and D) cell density shown as relative absorbance from the microBCA assay. These data show a delay in the SA beta-gal response compared to non-LPS treated macrophages (Figure 1). One-way ANOVA with post-hoc Dunnett Multiple Comparisons Test was applied, comparing all days to the day 1 time point. Significance is noted as p<0.05 * and p<0.001 **.

