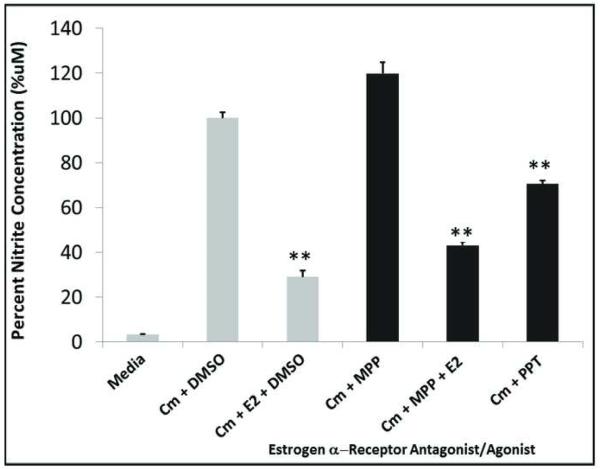
Figure 5.
Suppression of NO production involves ER-α. Hepatocytes were treated as described in Fig. 1. Concentrations of ER-α ligands were 10uM E2, 10uM PTT, a selective ER-α agonist and 10uM MMP, a specific ER-α antagonist. CM= Cytokine mix of rhIL-1b plus rrIFN-g. DMSO = Vehicle used as negative control.

