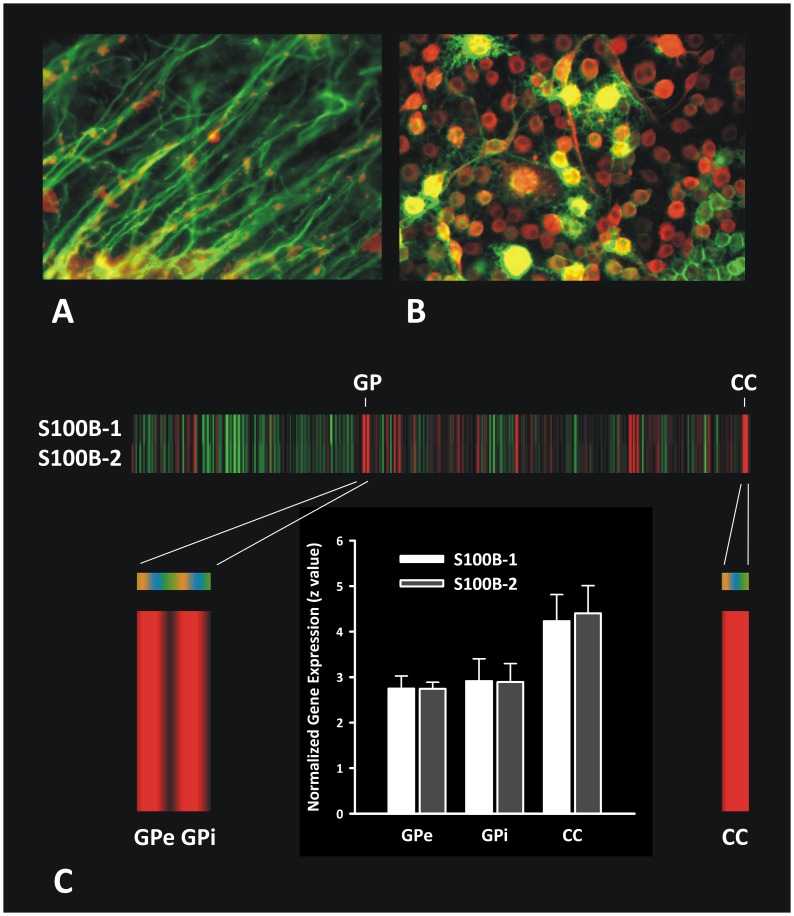
Figure 3. Expression and localization of S100B in the brain.
(A) Co-localization (yellow) of S100B (red) and myelin basic protein (MBP)-positive (green) myelinated fibres in the human corpus callosum. Data originate from the subject previously published [6]. (B) Co-localization (yellow) between S100B (red) and the oligodendroglial marker p75 neurotrophin receptor (green) in the oligodendrocyte cell line OLN-93. (C) Individual normalized gene expression of S100B in heat map in z scores normalized to whole human brain expression, where green indicates relatively low and red relatively high expression. Subjects are coded in orange, blue and green (H351.2001,.2002 and.1009). Highest expression was detected in the corpus callosum (CC), followed by globus pallidus (GP). Bar chart shows quantitative values in CC and external/internal (e/i) GP (mean+standard deviation). Gene expression of S100B was analyzed in two probes: Probe 1 A_23_P143526; Sequence: AGCTTGATTTGCTTTGTGATTGAAAAATTGAAAACCTCTTTCCAAAGGCTGTTTTAACGG; Probe 2 CUST_17042_PI416261804; Sequence: AAGCTGAAGAAATCCGAACTGAAGGAGCTCATCAACAATGAGCTTT CCCATTTCTTAGAG.

