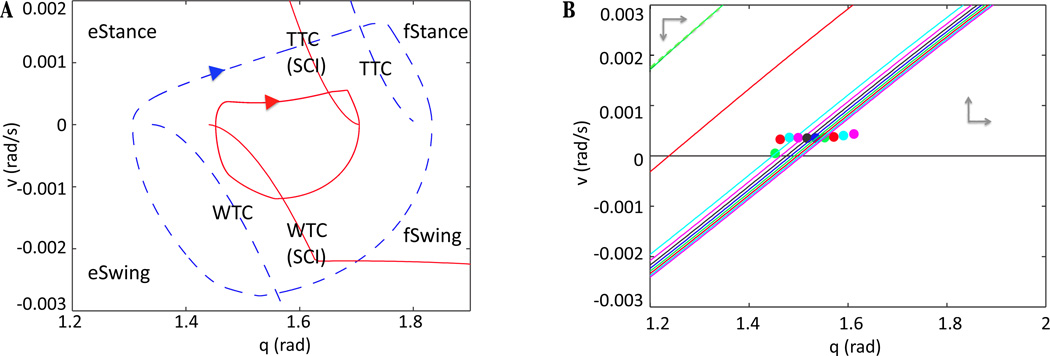
Figure 8.
Limb dynamics changes quantitatively and qualitatively after SCI. (A) Limb trajectory and transition curves under normal conditions (blue dashed) and SCI (red solid). By increasing the feedback strength, the transition curves shift, producing an oscillation of smaller amplitude as well as a qualitatively different velocity profile during eStance. (B) eStance υ-nullclines and limb position in phase space at different timepoints are indicated with corresponding colors. The earliest time points and nullclines are the farther to the left and are colored green, red, and cyan. A quick drop in the υ-nullcline near the onset of eStance, between the red time point and the cyan time point, causes the convex orbit shape seen after SCI.

