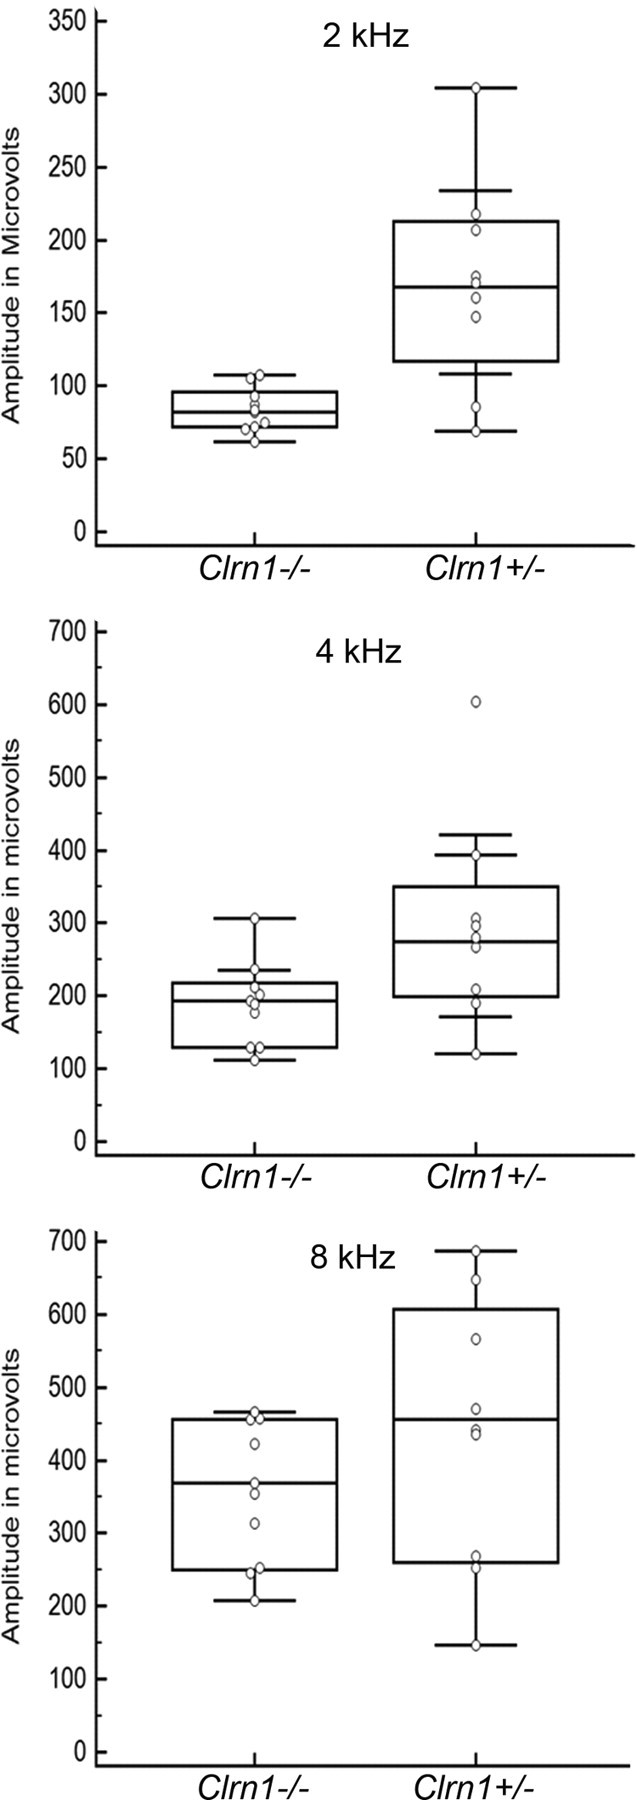
Figure 1.

Cochlear microphonics. CM was recorded from Clrn1−/− or Clrn1+/− mice (P18–P19) at 2, 4, and 8 kHz. The graph shows the spread of the data at each frequency tested for Clrn1−/− (n = 9) and Clrn1+/− (n = 8) mice. The results show that, on average, the receptor (hair cell) potential was lower in the Clrn1−/− mice compared with the controls. Amplitude reduction in Clrn1−/− mice was statistically significant at 2 kHz (p = 0.01) and 4 kHz (p = 0.04) but not 8 kHz (p = 0.15).
