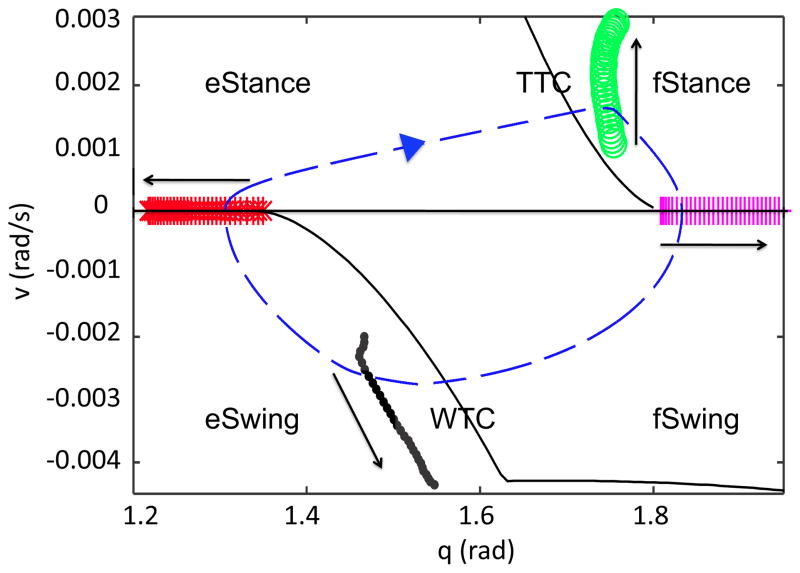
Figure 1.
Transitions between phases are marked over a range of drives. The solid arrows indicate the direction of increasing drive. Green circles denote the onset of fStance, magenta plus signs the onset of fSwing, black dots the onset of eSwing, and red stars the onset of eStance. The right hand side of the limb equation (1) changes in a discontinuous manner at each of these transitions. A sample trajectory (for drive=1.4), which evolves in the clockwise direction as time advances, is plotted with a blue dashed line for reference, and the transition curves are plotted in black. Notice that the CPG transitions lie close to the TTC and WTC, respectively, though they are shifted due to the brief transient the model exhibits between phases (see [13], Appendix).

