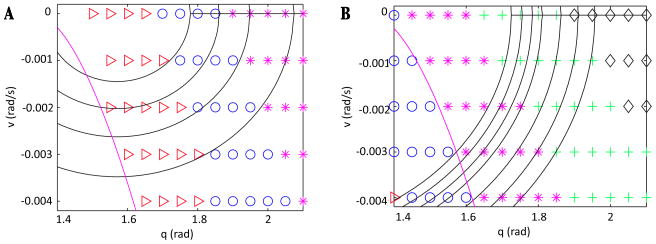
Figure 11.
v̇ values at sample (q, v) points and level sets of L in the fSwing phase for small Mn - F (A) and large Mn - F (B). In both plots, black diamonds, green plus signs, magenta stars, blue circles, and red arrows correspond to v̇ values within (+/−) 5e-6 of −5e-5, −4e-5, −3e-5, −2e-5, and −1e-5, respectively. Level curves of L̂ are plotted in black, with smaller L̂ values closer to the q-axis, and the WTC is plotted in magenta. Initial conditions for this phase lie on the q-axis with varying angle. For the drive shown in (A), the oscillation trajectory would begin fStance closer to the WTC but travel more slowly than in (B), where the trajectory would enter fStance at a larger angle but travel faster. For constant Mn - F output, trajectories move in the direction of decreasing L̂.

