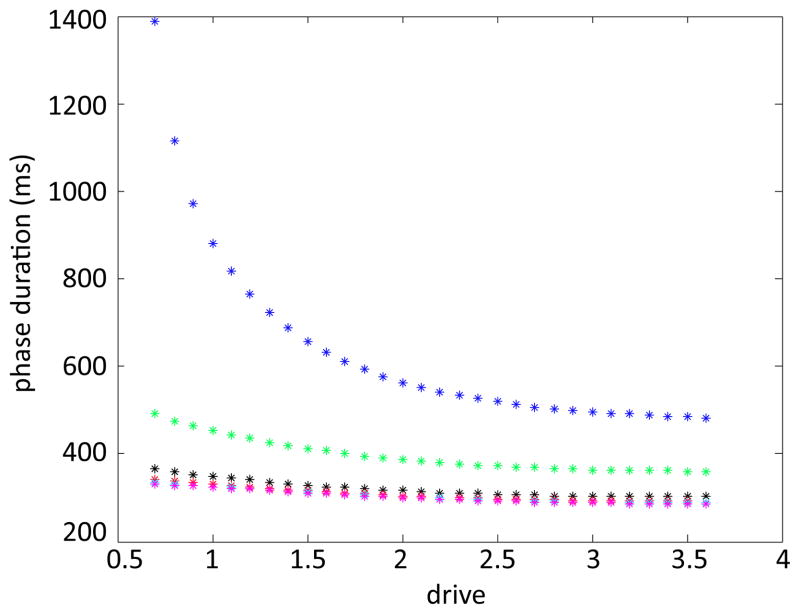
Figure 14.
Stance and swing durations for various ground reaction force magnitudes (MGRmax) are plotted against drive. The stance durations for full, half, and no GRF are plotted in blue, green, and black, respectively. The swing durations are plotted in red, cyan, and magenta and the resulting curves lie on top of each other. By reducing the impact of the ground strike force, the dependence of stance duration on drive (upper curves) is lost. The swing durations (lower curves) remain unaffected by this change.

