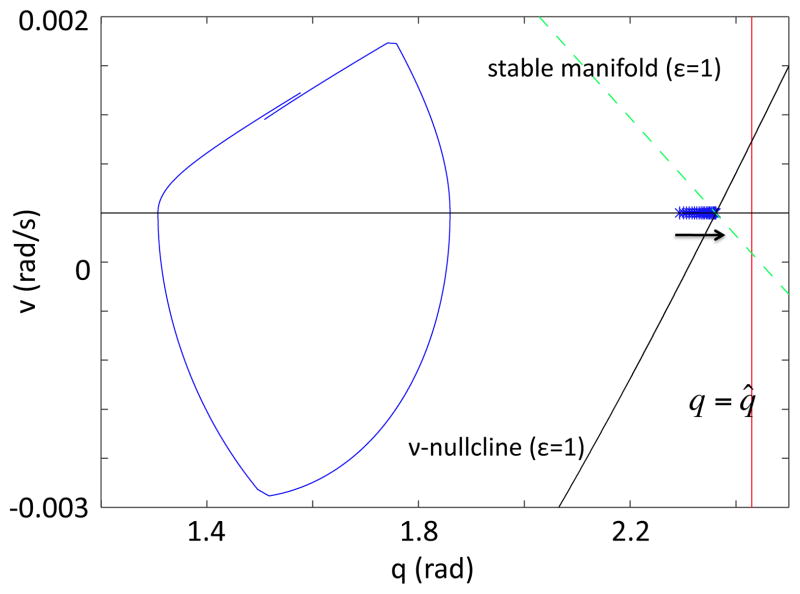
Figure 15.
Relationship between the critical points for system (9) and the angle upper bound, q̂. The critical points are plotted as blue asterisks on {v = 0} with an arrow indicating the trend in their location as ε increases, and the line {q = q̂} is indicated in red. The q and v-nullclines are plotted as black solid lines, and the stable manifold is a green dashed line for the ε = 1 system; these intersect in the rightmost critical point. For reference, the limit cycle for the ε = 1 system is plotted. In order to transition to the fSwing phase, the q-values on the limit cycle in fStance must be bounded above by the q-coordinates of the fStance critical point. q̂ was chosen as an upper bound of these bounds, so that M̂F is an upper bound of MF (q, v, mfSt).

