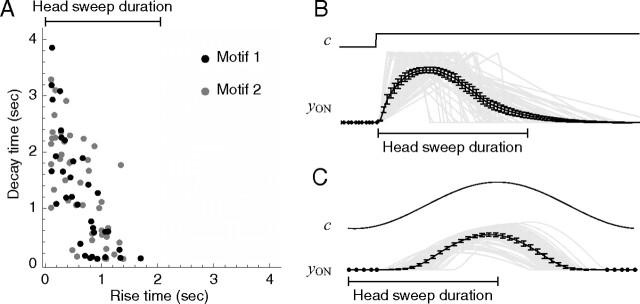
Figure 6.
Dynamics of chemosensory neurons in the model. A, Scatter plot of decay time vs rise time. Black dots correspond to networks in motif 1; gray dots correspond to networks in motif 2. B, C, Simulated response of chemosensory neurons to a step in concentration (B) and to sinusoidal input as would be generated by the head sweep oscillation (C). Top, Concentration. Bottom, black, ensemble average of chemosensory neuron activation across the population of networks; gray, responses of individual chemosensory neurons. Head sweep duration is shown for comparison. Error bars are SEM.

