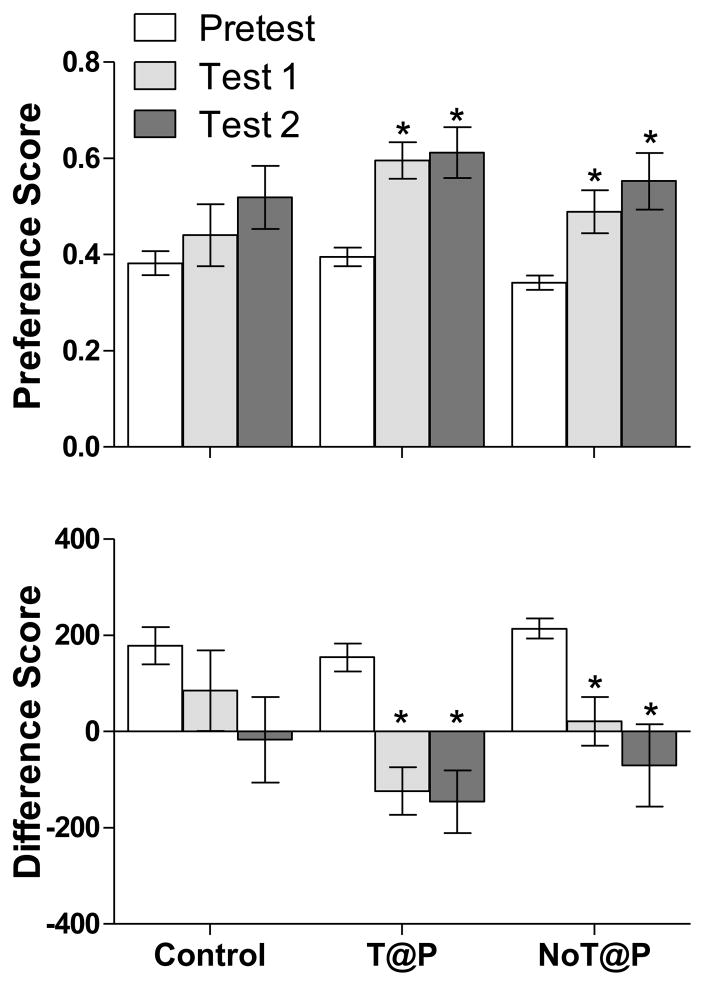
Figure 3.
Mean (±SEM) preference score and difference score on Pretest, Test 1, and Test 2 demonstrate that both T@P (n = 9) and NoT@P (n = 11) males showed a CPP for vaginal secretions. There was no difference in either score between Pretest, Test 1, and Test 2 for the intact, no-stimulus-paired controls (n = 12). *indicates a significant change in preference and difference score between the Pretest and Tests within a group, p < 0.05.

