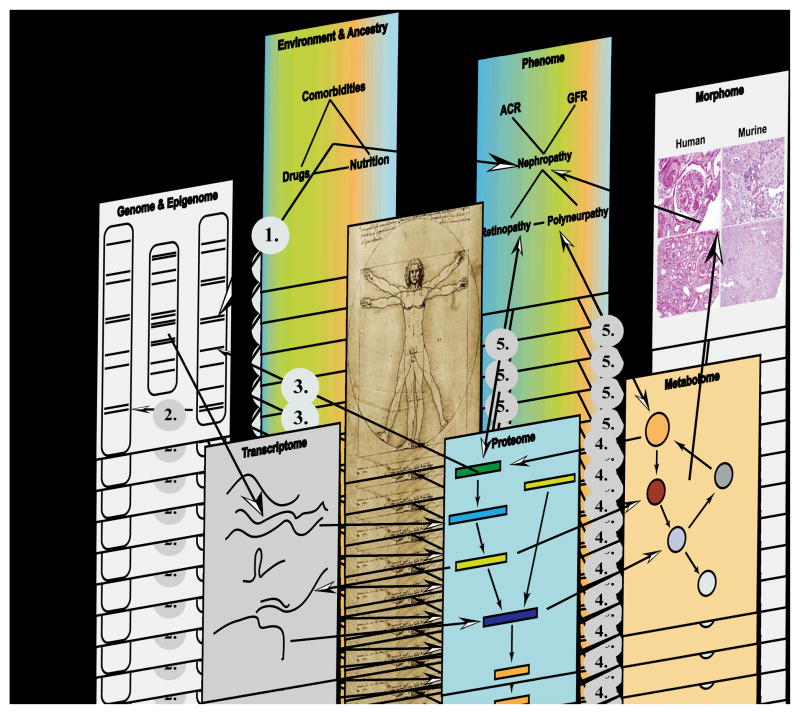
Figure 1. From Genome–to–Phenome – An Integrative Systems Biology Perspective on Diabetic Kidney Disease.
Each biological system (e.g. diabetic kidney) can be regarded as being composed of discrete components. Each component can be independently inquired through unbiased high throughput “–omics” profiling or imaging technologies (ultrasound, nuclear magnetic resonance imaging, positron emission tomography), but individual level data is embedded in an interaction network that connects and integrates the various components in a functional context. Potential interactions between two or more components are indicated through arrows e.g. gene–by–environment interaction (1), gene–by–gene interaction (2), protein–DNA interaction (3), metabolite–protein interaction (4) e.g. allosteric regulation of enzymes by small metabolites and reciprocal Phenome–“omes” interaction (5). Technologies applied to generate –omics level data are: Genome/Epigenome (SNPs, CNV, promoters): e.g. genome sequencing, high–density SNP chips, methylation assays (MeDIP), histone modifications; Transcriptome (mRNA, miRNA, lncRNA, piRNA, tRNA, rRNA): microarray(s) and RNA sequencing; Proteome (Phosphoproteome, Glycoproteome, Acetylome): yeast two–hybrid, coimmunoprecipitation, 2D differential gel electrophoresis; Metabolome (sugars, lipids, amino acids, small molecules): nuclear magnetic resonance spectroscopy and mass spectrometry; Morphome (tissue damage/integrity): histology, immunohistochemistry; Phenome (ACR, GFR, retinal microaneurysm): clinical chemistry, clearance measurement, imaging studies; Environment and Ancestry (Drugs, Nutrition, Comorbidities): nutritional assessment, environmental exposure and socio–economic assessment.

