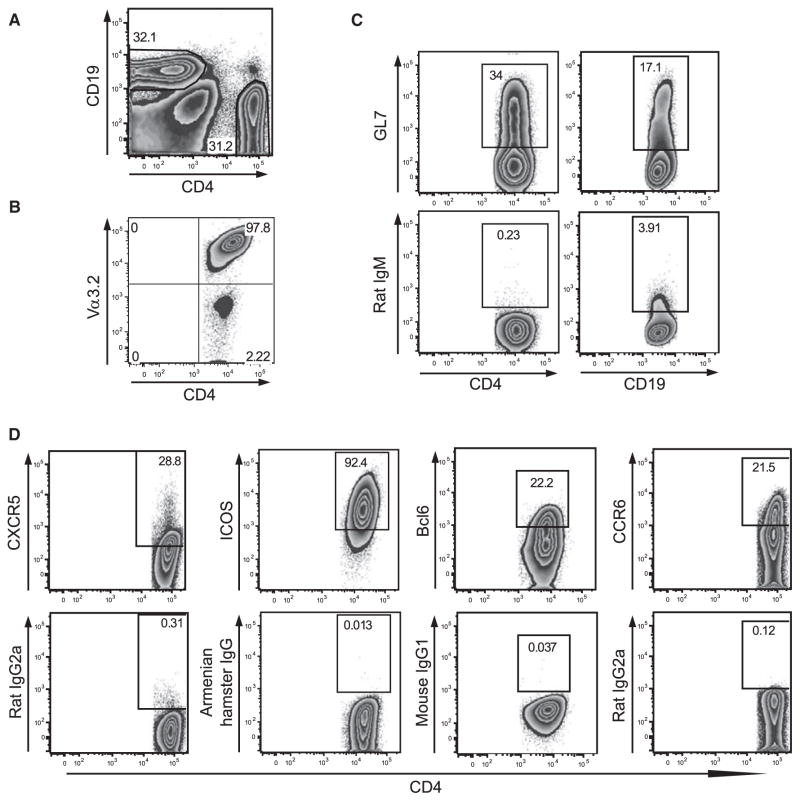
Figure 2. Th17 Cells Develop a Tfh Cell-like Phenotype in the CNS.
Infiltrating cells were isolated from the CNS of Th17 cell recipients at the peak of disease, i.e., mice had a score of 2.5–4 for 3–7 days. Cells were directly stained and analyzed by flow cytometry.
(A) The infiltrating cells were tested for CD4 and CD19 expression. About 30% of the infiltrating cells were T cells (range 28%–53%) and about 30% were B cells (range 5%–32%).
(B) The infiltrating cells were tested for expression of Vα3.2, which is part of the transgenic TCR expressed on transferred T cells. The vast majority of CD4+ T cells infiltrating the CNS of Th17 cell recipients are transferred cells expressing Vα3.2 (range 80%–99%).
(C) CNS T cells (left) and B cells (right) were analyzed for expression of GL7 by flow cytometry (range 15%–36% for T cells, 9%–17% for B cells).
(D) CNS-infiltrating T cells were analyzed for expression of CXCR5 (range 9%–90%), ICOS (range 40%–95%), Bcl6 (range 13%–27%), and CCR6 (range 5%–31%) by flow cytometry.
Flow cytometry data shown are representative of at least six individual mice from two or three independent in vivo experiments.

