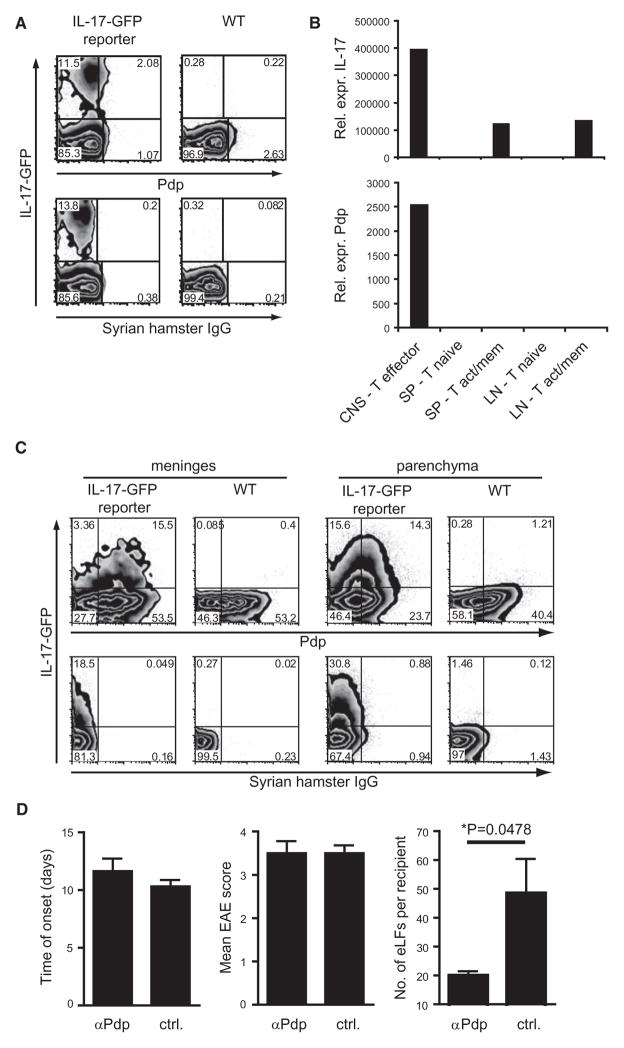
Figure 5. Pdp Is Expressed on Th17 Cells In Vivo and Is Important for Formation of the Ectopic Lymphoid Follicle-like Structures in Th17 Cell Recipients.
(A–C) WT and IL-17-GFP reporter mice were immunized with 100 μg MOG in CFA.
(A) On day 8 after immunization, splenocytes were harvested and cultured in the presence of MOG. After 4 days T cells were stimulated with PMA and ionomycin in the presence of monensin for 4 hr and analyzed for expression of IL-17-GFP and Pdp by flow cytometry. Data shown are representative of nine mice per group from two independent in vivo experiments.
(B) At the peak of disease, T cells were sorted from the CNS, spleen, and LNs and mRNA levels of IL-17 and Pdp were determined by quantitative PCR. Graphs are representative of two independent in vivo experiments.
(C) At the onset of disease, infiltrating cells were isolated from meninges and CNS parenchyma and expression of Pdp and IL-17-GFP on CD4+ T cells was determined by flow cytometry directly ex vivo. Data shown are representative of four mice per group from two independent experiments.
(D) Th17+IL-23 cells were transferred into WT recipients treated with 100 μg polyclonal anti-Pdp on day 0, 2, 4, and 7 after transfer. Control animals were treated with goat IgG or PBS. Mice were monitored daily for development of EAE, and 30–40 days after transfer, the CNS of recipients was harvested for histological analysis. Bar graphs show the time of disease onset (left), the mean maximum disease score (middle), and the number of eLFs per recipient (right) for the anti-Pdp-treated mice versus control mice. Graphs show combined data from two independent experiments. Error bars represent SEM. The difference between the groups was tested for significance by an unpaired Student’s t test with Welch’s correction (*p = 0.0478) (right). Further information can be found in Table S2.

