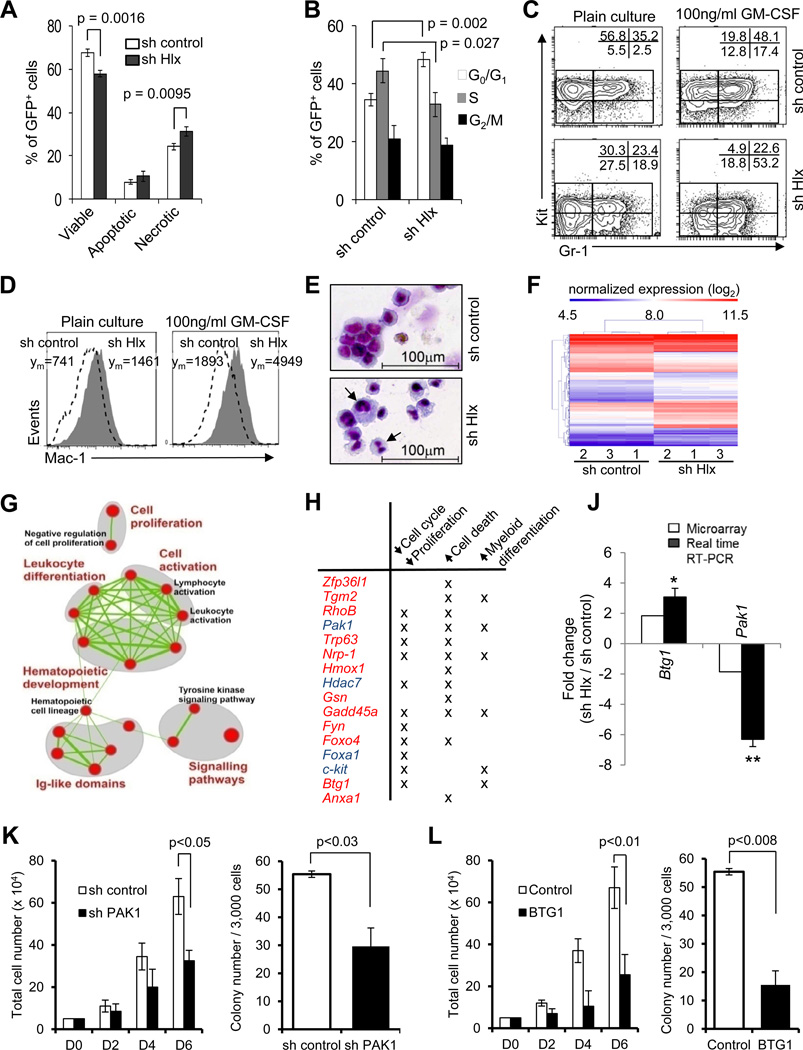
Figure 5. Inhibition of HLX leads to decreased cell cycling, increased cell death, and differentiation of AML cells, and causes significant changes in gene expression.
(A) Relative percentages +/− SD of viable cells (DAPI-negative/Annexin V-negative), apoptotic cells (DAPI-negative/AnnexinV-positive) and necrotic cells (entire DAPI-positive) in sh control cells (white bars) and sh Hlx cells (black bars). p values are indicated (N=3). (B) Cell cycle status of sh control and sh Hlx leukemia cells. Percentages of cells in G0/G1 (white bars), S (gray bars), and G2/M (black bars) phase of cell cycle are displayed. Statistical significance is indicated (N=3). (C, D) Cell surface marker analysis after suspension culture for 3 days. Relative percentages of cells in the indicated gates are given, and show a decrease of immature Kit+ cells and an increase of Kit−Gr1+ cells (C), and an increase of Mac1+ cells (D). (E) Morphology of cells after treatment with 100ng/ml recombinant GM-CSF for 3 days. Cells with maturation signs are indicated by arrows. (F) Hierarchical clustering of genes differentially expressed in URE leukemia cells upon HLX knockdown. Expression levels are color-coded. (G) Enrichment map representation of cellular processes perturbed in leukemia cells upon HLX knockdown. Enriched gene sets are represented as nodes (red circles) connected by edges (green links) denoting the degree of gene set overlap. The node size is proportional to the number of genes in the gene set and the edge thickness represents the number of genes that overlap between gene sets. The color intensity of the nodes indicates the statistical significance of enrichment of a particular gene set. Groups of functionally related gene sets are circled in gray and labeled. A more comprehensive enrichment map is shown in Fig. S5. See Table S1 for additional information. (H) Select genes altered by HLX inhibition in URE leukemia cells. Up-regulated genes are shown in red and down-regulated genes are shown in blue. Their involvement in regulation of cell cycle/proliferation, cell death, and myeloid differentiation is indicated. (J) Validation of differential mRNA expression of Btg1 and Pak1. Fold changes +/− SD upon HLX knockdown are shown. (* p<0.05; ** p<0.01, N=3). Additional qRT-PCR validation is shown in Fig. S5. (K) Short hairpin (shPAK1) or a control (sh control) were used to downregulate HLX downstream target PAK1 in human AML cell line KG1a. Proliferation (left panel) and clonogenicity (right panel) are shown. Error bars indicate SD (N=4). (L) Effect of BTG1 overexpression on KG1a proliferation (left panel) and colony formation capacity (right panel). Error bars indicate SD (N=4). Quantification of PAK1 knockdown and BTG1 overexpression are shown in Fig. S5C and S5D.

