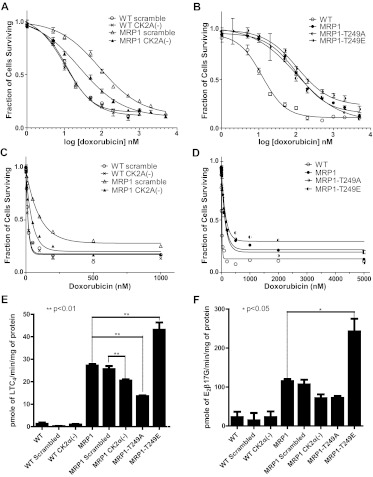
Fig. 3.
Knockdown of CK2α and MRP1-Thr249 mutations alter MRP1 function in tissue culture and in vitro transport assays. Doxorubicin cytotoxicity profiles were determined by MTT assay as described under Materials and Methods. Points represent mean values ± 95% confidence intervals of three or more separate experiments performed with repeated measures in 96-well plates. The data were normalized to the baseline absorbance. Four-parameter logistic nonlinear regression model fit and fraction of cell survival-doxorubicin concentration data plots were generated with use of GraphPad Prism 5. Summary statistics derived from these data are listed in Table 1. A, four-parameter logistic nonlinear regression curve fit for WT scrambled, WT CK2α (−), MRP1 scrambled, MRP1 CK2α(−). B, four-parameter logistic nonlinear regression curve fit for WT, MRP1, MRP1-T249A, and MRP1-T249E. C, fraction of cell survival-doxorubicin concentration data plot for WT scrambled, WT CK2α (−), MRP1 scrambled, and MRP1 CK2α(−). D, fraction of cell survival-doxorubicin concentration data plot for WT, MRP1, MRP1-T249A, and MRP1-T249E. In vitro transport into inside-out vesicles prepared from presented cell lines was measured for two 3H-labeled MRP1 substrates, LTC4 (E) and E217βG (F). Transport experiments were performed in triplicate or greater, and the bar graph shows mean values ± S.D. Statistical analysis was performed using one-way ANOVA followed by Bonferroni post test.

