Figure 1.
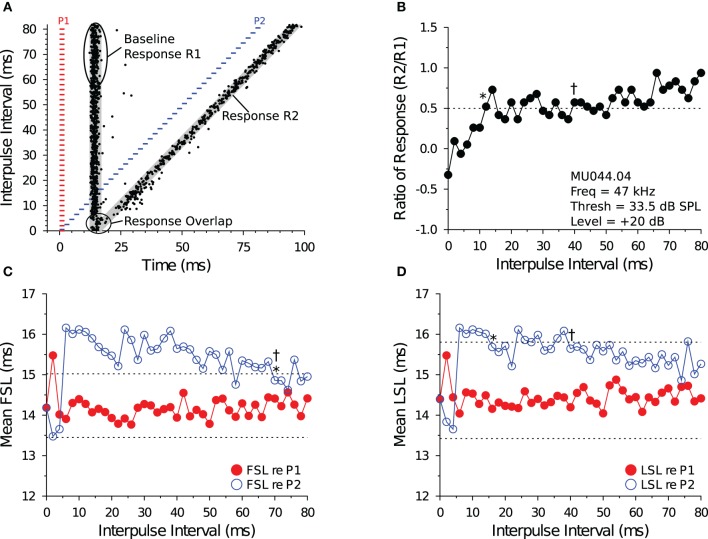
Measuring recovery cycle times of IC neurons. (A) Dot raster display of an in vivo shortpass DTN in response to paired tone stimulation at varying IPIs. The red bars represent the onset, duration, and offset of the first tone pulse (P1), and the blue bars represent the onset, duration, and offset of the second tone pulse (P2). Stimuli P1 and P2 were set to the cell's BEF and, if duration-tuned, BD. The timing of action potentials are illustrated as black dots. We calculated the mean ± SD baseline FSL and baseline LSL in response to P1 over the 10 longest IPIs from the onset of P1 to the onset of P2. Baseline latencies were used to define the P1 and P2 analysis windows (gray regions) used for assigning spikes as being evoked by stimulus P1 or P2, and for calculating the Baseline Response R1. The P1 analysis window began at the onset of P1 + baseline FSL − 2 SDs and ended at the onset of P1 + mean LSL + 2 SDs (re P1). The P2 analysis window began at the onset of P2 + baseline FSL − 2 SDs and ended at the onset of P2 + mean LSL + 2 SDs (re P2), and was used to measure the responses evoked by P2 (Response R2). For trials where the P1 and P2 analysis windows overlapped, a single analysis window was defined starting from the onset of P1 + baseline FSL − 2 SDs and ending at the onset of P2 + baseline LSL + 2 SDs. (B) Recovery times measured with spike count. The ordinate shows the spike count ratio of response (R2/Baseline R1) as a function of stimulus IPI. The dotted line at 0.5 represents the 50% spike count recovery threshold. The asterisk (*) at 12 ms illustrates the recovery time of the cell determined with the short-to-long method, and the dagger (†) at 40 ms represents the recovery time of the same cell determined with the long-to-short method. (C,D) Recovery times measured with spike latency. The red line with closed symbols represents spike latency (re P1), and the blue line with open symbols represents spike latency (re P2). The dotted lines represent ± 1 SD relative to the mean baseline FSL or baseline LSL (see A). (C) Mean FSL (re P1 and P2) as a function of IPI. The asterisk (*) at 70 ms illustrates the FSL recovery time measured with the short-to-long method, and the dagger (†) at 70 ms represents the FSL recovery time of the same cell determined with the long-to-short method. (D) Mean LSL (re P1 and P2) as a function of IPI. The asterisk (*) at 16 ms illustrates the LSL recovery time of the cell measured with the short-to-long method, and the dagger (†) at 40 ms represents the LSL recovery time of the same cell determined with the long-to-short method. In this example, FSL took longer to recover than LSL. MU044.04.09: BEF, 47 kHz; BD, 2 ms; threshold, 33.5 dB SPL; amplitude +20 dB re threshold; 20 repetitions per IPI step.

