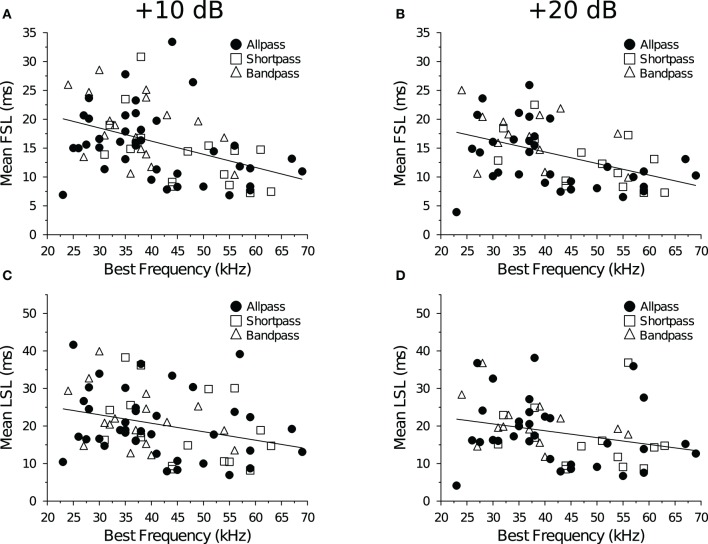
Figure 3.
Spike latency and tonotopy in the IC. (A,B) First-spike latency as a function of BEF. Neurons with lower BEFs had longer average FSLs at both (A) +10 dB (R2 = 0.18, p = 0.00019) and (B) +20 dB (R2 = 0.21, p = 0.00031) re threshold. (C,D) Last-spike Latency as a function of BEF. Neurons with lower BEFs had longer average LSLs at both (C) +10 dB (R2 = 0.087, p = 0.011) and (D) +20 dB (R2 = 0.070, p = 0.044) re threshold.

