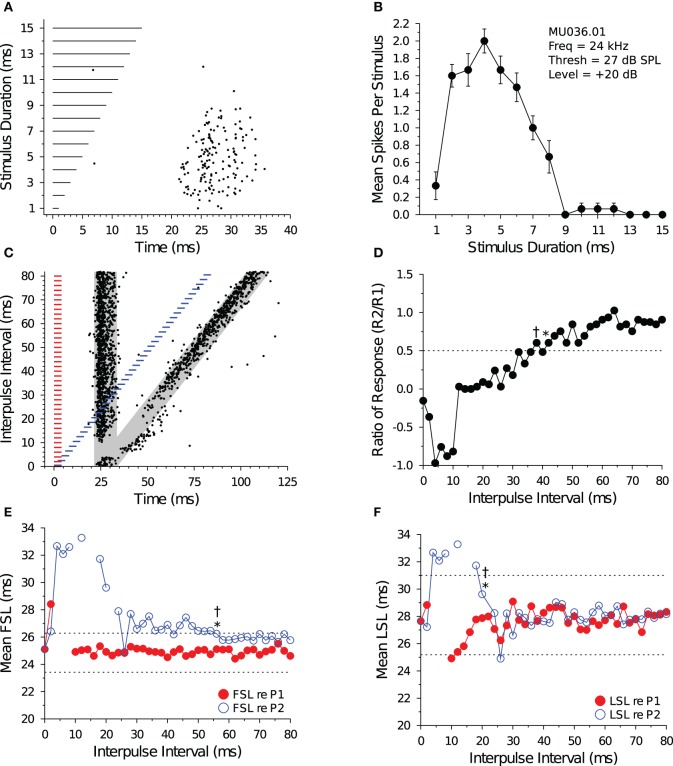
Figure 4.
Response and recovery in a bandpass DTN. (A) Dot raster display of spiking in a bandpass DTN in response to variable duration BEF tones. (B) Mean ± SE spikes per stimulus as a function of stimulus duration. This cell had a BD of 4 ms. (C) Dot raster display illustrating spiking in response to pairs of BD tones presented at variable IPIs. The shaded gray regions illustrate the customized P1 and P2 analysis windows bounded by ±2 SDs from the baseline FSL and baseline LSL of the cell (see Figure 1). (D) Spike count ratio of response as a function of IPI. Evoked spiking in response to P2 recovers to within 50% of baseline (dotted line) in response to P1 at 42 ms using the short-to-long method (*), and at 38 ms using the long-to-short method (†). (E) Mean FSL and (F) mean LSL as a function of IPI for responses evoked by P1 (red closed symbols) and P2 (blue open symbols). (E) The cell's FSL (re P2) returns to within 1 SD of baseline at 56 ms using both the short-to-long and long-to-short methods, whereas (F) the LSL (re P2) returns to within 1 SD of baseline at 20 ms using both the short-to-long and long-to-short methods. Latencies determined after windowing responses with the cell-specific P1 and P2 analysis windows. Dotted lines represent ±1 SD relative to baseline latency (re P1). Missing values represent IPIs where no spikes fell into the analysis window. (A,B) MU036.01.06: BEF, 24 kHz; threshold, 27 dB SPL; amplitude +20 dB re threshold; 15 repetitions per stimulus. (C–F) MU036.01.31: BEF, 24 kHz; threshold, 27 dB SPL; amplitude +20 dB re threshold; 20 repetitions per IPI step.

