
Fig. 4.
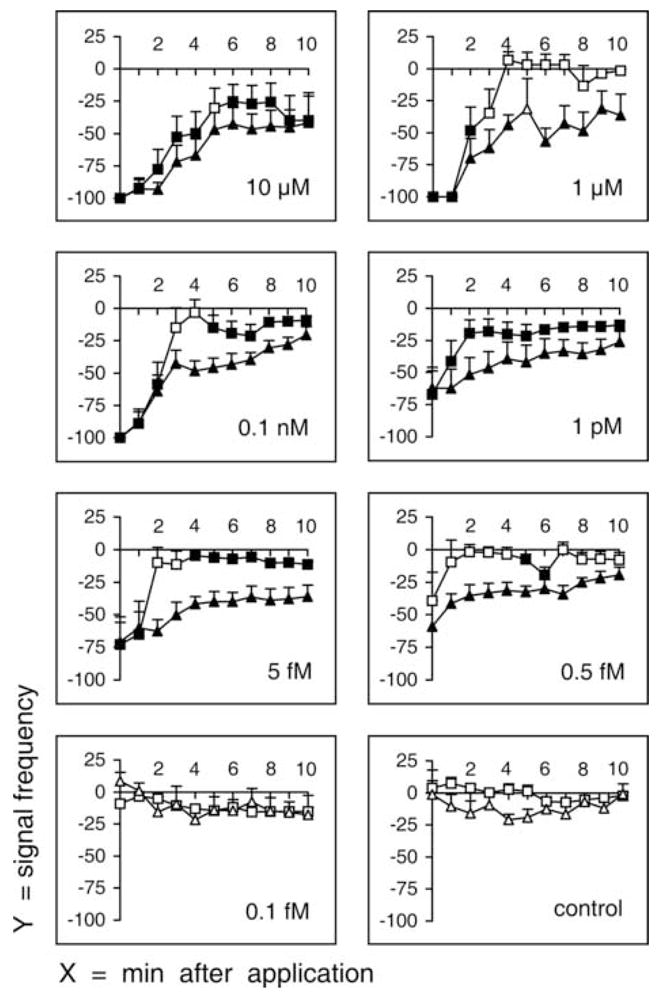
Signal frequency of fast phase and slow phase after injection of different concentrations of dromyosuppressin (DMS). Fast phases and slow phases were recorded immediately after injection (time 0) and continuously for 10 minutes (x-axis, minutes after injection). Signal frequency (y-axis) is reported as mean value ± SE (percentage variation following injection; squares, fast phase; triangles, slow phase). Each DMS concentration was tested in 10 flies. Saline was applied as a control in 10 flies. Filled symbols indicate significance (P < 0.05; Wilcoxon Test).