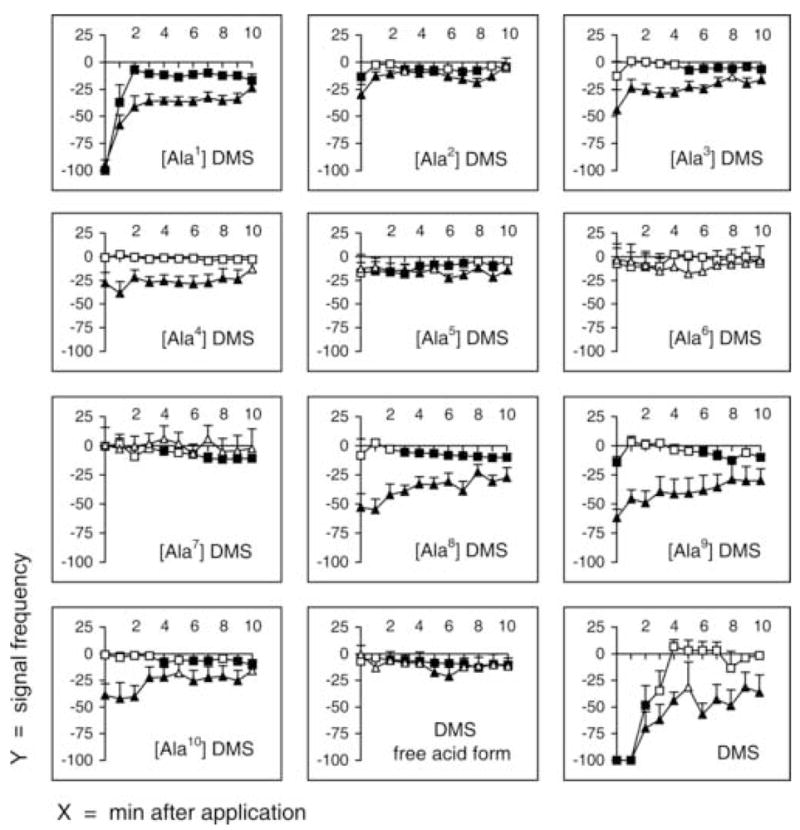
Fig. 6.

Signal frequency of fast phase and slow phase after injection of alanyl-substituted dromyosuppressin (DMS) analogs and DMS free acid. Fast phase and slow phase were recorded immediately after injection (time 0) and continuously for 10 minutes (x-axis, minutes after injection). Signal frequency (y-axis) is reported as mean values ± SE (percentage variation following injection; squares, fast phase; triangles, slow phase). DMS and each analog (1 μM) were tested individually, using an animal only once, in 10 flies. Filled symbols indicate significance (P < 0.05; Wilcoxon Test).
