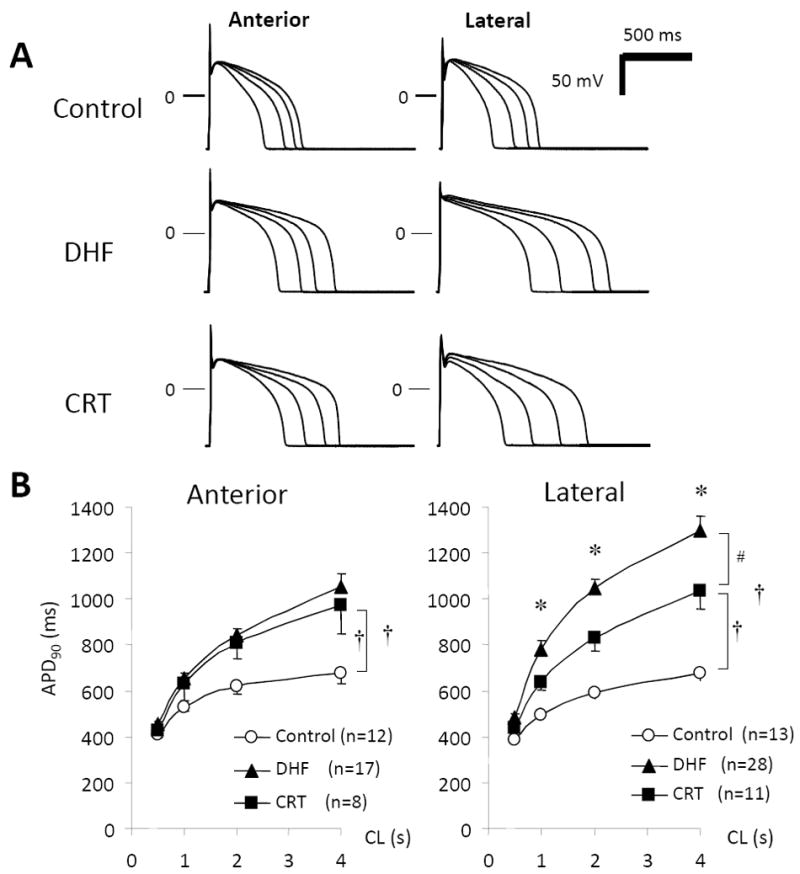
Figure 3.

APD in LV myocytes from control, DHF, and CRT hearts. A, Representative superimposed APs recorded at pacing cycle lengths (CL) of 0.5, 1.0, 2.0, and 4.0 seconds, B, Relationship between pacing CL and APD at 90% recovery (APD90) from anterior and lateral myocytes in each group. †P<0.05 vs. control; #P<0.05 vs. DHF; *P<0.05 vs. anterior (adapted from Aiba et al.51).
