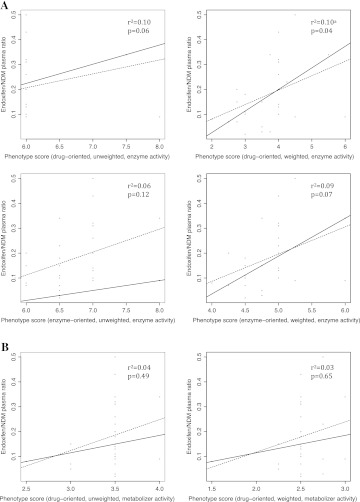
Figure 3.
Scatterplot and quantile regression fit. The plots show scatter plots of the endoxifen/N-desmethyltamoxifen (NDM) ratio versus phenotype scores. Superimposed on the plots are the median fit (solid line) and the least squares estimate of the conditional mean function (dashed line). (A) Phenotype scoring systems that assign numeric values according to ‘allelic variant’–‘enzyme activity’ association assertions. (B) Phenotype scoring systems that assign numeric values according to ‘genotype’–‘metabolizer activity’ association assertions. aA p value of ≤0.05 is considered statistically significant, indicating significant difference in the regression coefficient medians.

