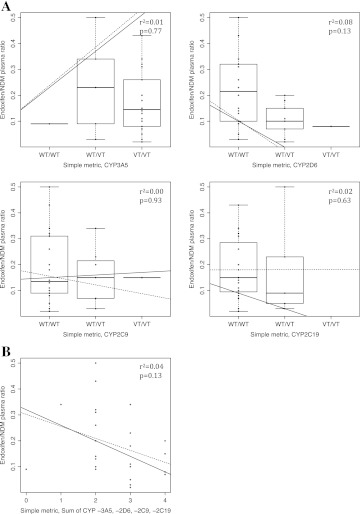
Figure 4.
(A) Simple metrics for individual genes with genotype values as Vt/Vt=2, Wt/Vt=1, and Wt/Wt=0: CYP3A5 Wt=*1, Vt=*3,*6; CYP2D6 Wt=*1, Vt=*4,*6; CYP2C9 Wt=*1, Vt=*2,*3; and CYP2C19 Wt=*1, Vt=*2. Wt/Wt=0, Wt/Vt=1, Vt/Vt=2. The plots show box-plots of the endoxifen/N-desmethyltamoxifen (NDM) ratio versus genotype values. Superimposed on the plots are the median fit (solid line) and the least squares estimate of the conditional mean function (dashed line). (B) Simple metric for the sum of genotype values for genes CYP3A5, CYP2D6, CYP2C9, and CYP2C19. The lines indicate median bands. The plots show scatter plots of the endoxifen/NDM ratio versus simple metrics. Superimposed on the plots are the median fit (solid line) and the least squares estimate of the conditional mean function (dashed line).

