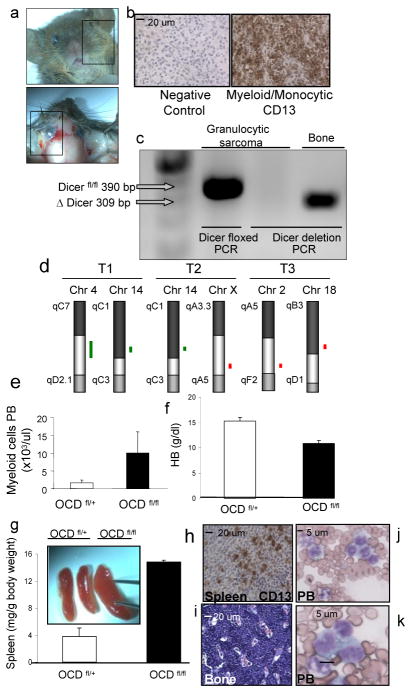
Figure 4. Myeloid sarcoma and acute myelogenous leukemia in OCD fl/fl mice.
a, tumors infiltrating soft tissue in 2–4 weeks old mice. Data from one representative animal. b, tumor sections showing predominantly myeloblasts admixed with maturing granulocytes, typical of myeloid sarcoma and confirmed by immunostaining with CD13. c, exclusion of Dicer1 deletion in myeloid sarcoma cells by genomic PCR. Bone from the same animal as positive control. d, genomic aberrancies detected in myeloid sarcomas (n=3) as detected by array-based CGH. A common amplified region was identified on chromosome 14qC1 in two tumors. Green lines represent amplifications, red line represents deletion e, myelocytosis, f, anemia, g, splenomegaly with h, infiltration of CD13+ blasts in the spleen and i, bone marrow, and j–k, monocytic blasts in a background of dysplastic granulocytes in the peripheral blood. HB=hemoglobin, PB=peripheral blood

