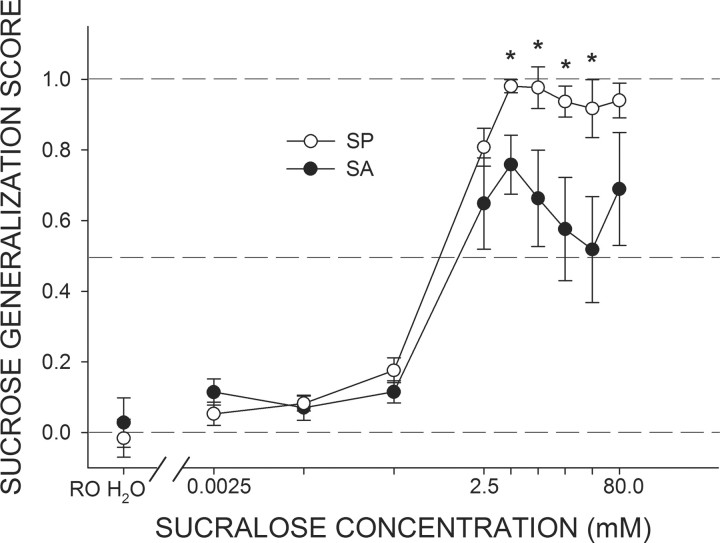
Figure 1.
Mean (±SEM) Sucrose Generalization Scores for SA and SP rats in response to increasing concentrations of sucralose used as a test stimulus. A score of 0.0 indicates that responding to the test stimulus was identical to responding for 1.0 mm quinine; a score of 1.0 indicates that responding to the test stimulus was identical to responding for 600 mm sucrose. All rats, regardless of sucralose preference phenotype, treated water and the three lowest concentrations of sucralose as sharing a perceptual quality similar to that of 1.0 mm quinine. As the concentration of sucralose was increased beyond 2.5 mm, mean responding by SP and SA rats began to separate, with SP rats reporting that the salient taste quality associated with sucralose was similar to that of 600 mm sucrose, whereas SA displayed a pattern of responses indicative of sucralose sharing perceptual qualities of both 600 mm sucrose and 1.0 mm quinine. *SP rats greater than SA rats, ps < 0.05.

