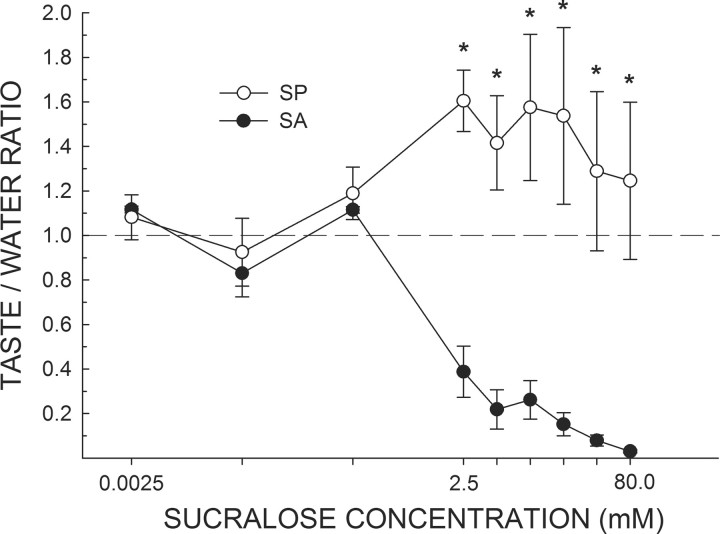
Figure 3.
Mean (±SEM) taste/water ratio of water-deprived SA and SP rats in response to increasing concentrations of sucralose presented in random order during brief-access tests in the Davis rig. A score of 1.0 indicates that the mean licking response to that concentration of sucralose was equal to the overall mean licking response to water. In agreement with Experiment 1, all rats treated the three lowest concentrations of sucralose as similar to water. By the 2.5 mm concentration, SP rats increased licking and SA rats decreased licking in response to increasing concentrations of sucralose. *SP rats greater than SA rats, ps ≤ 0.01.

