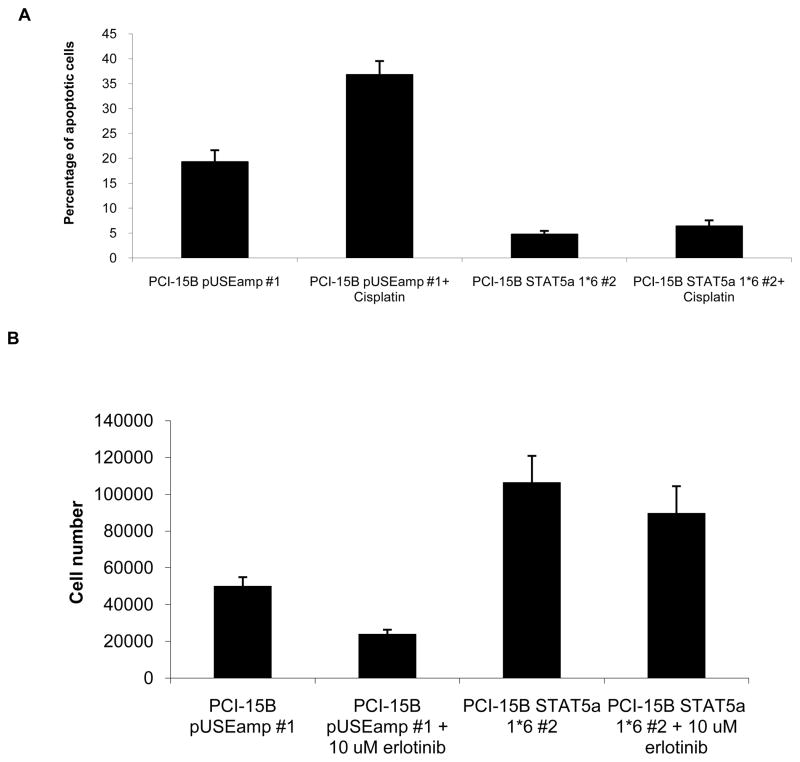
Figure 6. Activation of STAT5 increases resistance to cisplatin-induced apoptosis and erlotinib-induced growth inhibition.
(A) 0.4×10⁵ cells of PCI-15B pUSEamp #1 and PCI-15B STAT5a 1*6 #2 were plated in complete DMEM, with or without 10 μM cisplatin. 24 hrs post drug treatment, cells were harvested for Annexin staining. 8–10 fields were quantified per sample in each experiment. The graph represents cumulative data from four independent experiments showing decreased apoptosis in response to cisplatin in the cells expressing dominant-active STAT5 (p=0.0143). (B) 0.2×10⁵ cells each of PCI-15B pUSEamp #1 and PCI-15B STAT5a 1*6 #2 were plated in complete medium in 12-well plates. Twenty-four hours later, cells were treated with erlotinib (10 μM). Cell counts were performed 48 hours after treatment, using trypan blue vital dye exclusion. Percent inhibition of cell growth induced by erlotinib was calculated compared with DMSO treated controls for both PCI-15B pUSE amp#1 and PCI-15B STAT5a 1*6 #2. The graph represents cumulative data from six independent experiments (p=0.0011).

