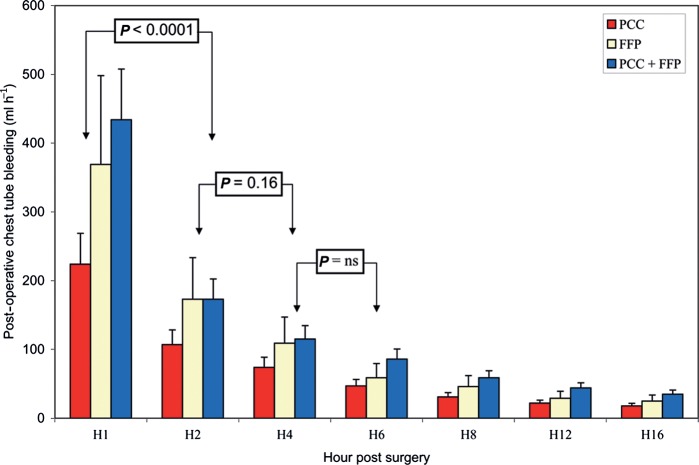
Figure 1:
Course of chest tube blood loss. Initial blood loss at H1 was different between the three groups (P = 0.05). Only group I vs group III presented a significant difference (P = 0.05) for blood loss at H1. Variations of blood loss over time were not different according to the treatment groups (P = 0.12). Decrease in blood loss was significantly different between H1 and H2 (P < 0.0001). After H2, no significant changes were demonstrated: P = 0.16 between H2 and H4.

