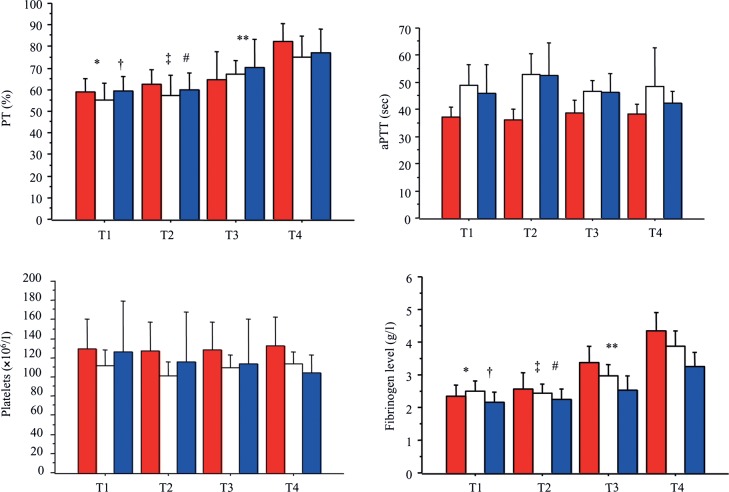
Figure 3:
Course of biological parameters. T1: at ICU admission; T2: 6 h ± 4 after ICU admission; T3: 11 h ± 5 after ICU admission; T4: 24 h after ICU admission. Red boxes: prothrombin complex concentrates (group I); White box: fresh frozen plasma (group II); blue boxes: prothrombin complex concentrates and fresh frozen plasma (group III). Prothrombin time (PT). Course of PT varied over time: *T1 vs T3 (P = 0.008); †T1 vs T4 (P < 0.0001); ‡T2 vs T3 (P = 0.05); #T2 vs T4 (P = 0.0001); **T3 vs T4 (P = 0.006). Variations of PT over time were not different according to the treatment groups. There was no difference between groups for PT. Activated partial thromboplastin time (aPTT). Course of aPTT did not vary over time. Variations of aPPT over time were not different according to the treatment groups. Values of aPTT were different between group I vs group II (P = 0.04). Platelet count. Course of platelet count did not vary over time. Variations of platelet count with time were not different according to the treatment groups. There was no difference between groups for platelet count. Fibrinogen. Course of fibrinogen varied over time: *T1 vs T3 (P < 0.0001); †T1 vs T4 (P < 0.0001); ‡T2 vs T3 (P < 0.0001); #T2 vs T4 (P < 0.0001); **T3 vs T4 (P < 0.0001). Variations of fibrinogen over time were different according to the treatment groups (P < 0.0001). Values of fibrinogen were different between group I vs group III (P = 0.03).

