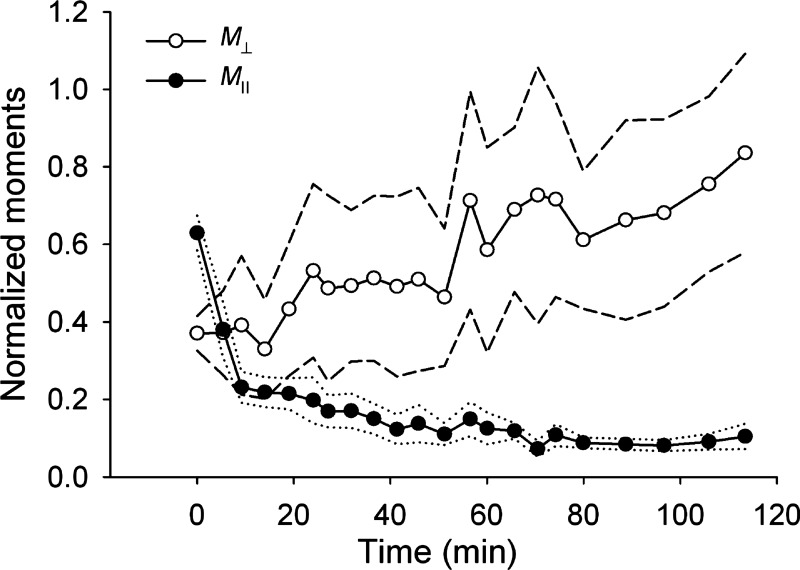
Fig. 3.
Time course of the average values of the normalized components of the contractile moment matrix parallel with (M‖) and perpendicular to (M⊥) the stretch axis for cells subjected to 10% strain pulses repeated every 49 s. Both M‖ and M⊥ were normalized with the baseline value of the net contractile moment (i.e., baseline value of M‖ + M⊥). Data are means (n = 10 cells); dotted lines are ± SE for M‖ and dashed lines are ± SE for M⊥.

