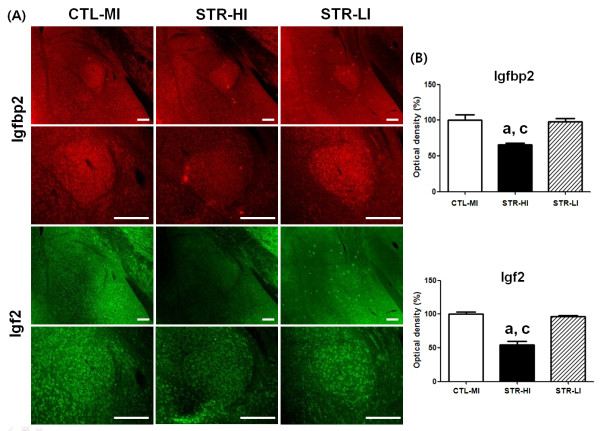
Figure 5.
The expression of Igfbp2 and Igf2 in the amygdala was analyzed using IHC in the three groups; CTL-MI, STR-HI, and STR-LI mice. IHC showed specific decreased expression of Igfbp2 and Igf2 in the CeA nucleus of STR-HI mice (A). The fluorescence signal density was quantified using the NIH Image J program, and the strength of IHC was evaluated with one-way ANOVA and Tukey’s multiple comparison tests among groups. Igfbp2 (F = 13.52) and Igf2 (F = 53.25) showed statistically significant differences among groups with one-way ANOVA. Tukey’s post tests revealed that only the STR-HI mice had a significant decrease in two proteins in the CeA (B). Data are the means ± SEM (n = 3). a, P < 0.05 between CTL-MI and STR-HI mice; c, P < 0.05 between STR-HI and STR-LI mice. Scale bars are 200 μm

