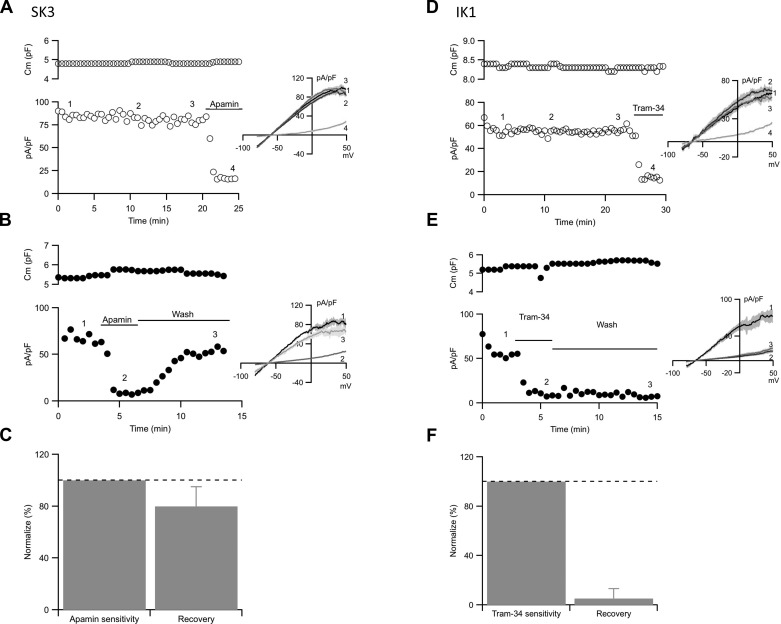
Fig. 2.
SK3 and IK1 current recovery from blockers. A and B: cell membrane capacitance (top) and whole cell SK3 current density (bottom) plotted against experimental time for control cell (A) and recovery from apamin cell (B). C: category plot showing the normalized current density recovery from apamin block. D and E: cell membrane capacitance (top) and whole cell IK1 current density (bottom) plotted against experimental time for control cell (D) and recovery from tram-34 cell (E). F: category plot showing the normalized current density recovery from tram-34 block. Horizontal bars denote the presence and washout of apamin or tram-34 from the bath. Numbers on the plots correspond to the representative traces (insets). Dash lines on the bar graphs show 100% (control).

