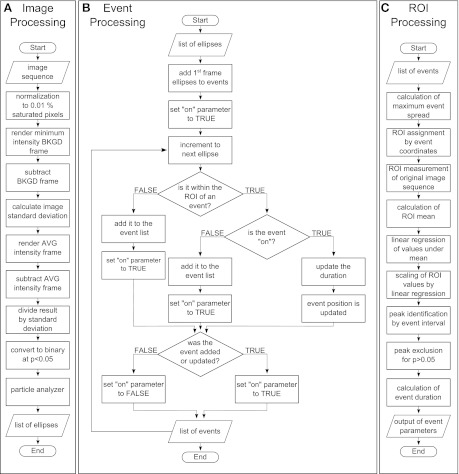
Fig. 1.
Signal flow charts of algorithm processes. The algorithm was organized into three sections: image processing, event processing, and region of interest (ROI) processing. Image sequences are input into the flow chain, and event statistics are generated as final output. The image processing (A) subroutine of the algorithm converts the input image sequence into a list of best-fit ellipses by thresholding using the standard score and ImageJ particle analysis. Event processing (B) is a sorting subroutine used to determine optimum ROI position by organizing ellipse locations into event “sites” by time. After mean intensity measurements are taken at each ROI, statistical parameters for each event and site are then calculated by the ROI processing subroutine (C) to generate the final output. BKGD, background; AVG, average.

