Fig. 5.
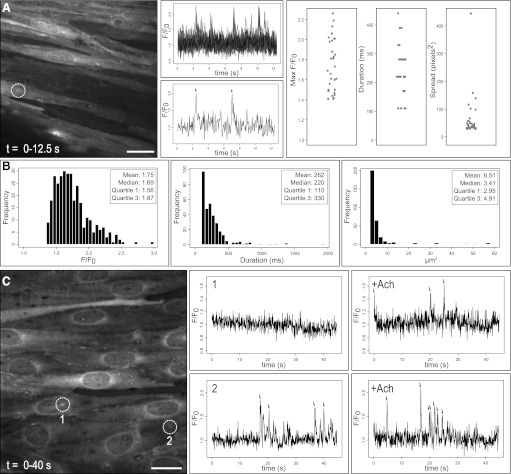
Automated analysis of endothelial Ca2+ events (Ca2+ pulsars) in intact arterial preparations. Mesenteric resistance arteries of the GCaMP2 mouse were opened longitudinally and Ca2+-dependent fluorescence in the endothelium was measured. Distinct, low signal-to-noise ratio Ca2+ transients were detected within background noise and image artifact. A: a projected time lapse image of a 12.5-s recording from a single field of endothelial cells is shown, including average fluorescence intensity from all detected ROIs (top) and from a single ROI (bottom; corresponding to white circle in image). Strip charts summarize the parameter distributions of events detected in a single experiment, including peak amplitude, half-maximum duration, and maximum area spread. B: histograms show distributions of these parameters compiled from eight image sequences (total of 326 events from 161 sites). Parameter distributions were distinctly non-Gaussian. Summary statistics including mean, median, and interquartile ranges are shown in the inset. C: our algorithm also detected and tracked events stimulated by 10 μM acetylcholine. A projected time lapse image of a 40-s recording after acetylcholine stimulation is shown. Tracings recorded before and after acetylcholine at two detected sites (indicated by white circles) show recruitment of de novo Ca2+ pulsars at a previously inactive site (1) as well as an increase in pulsar frequency at a site with preexisting activity (2). All detected and measured events are designated by arrows. Scale bars represent 20 μm (A) and 15 μm (B).

