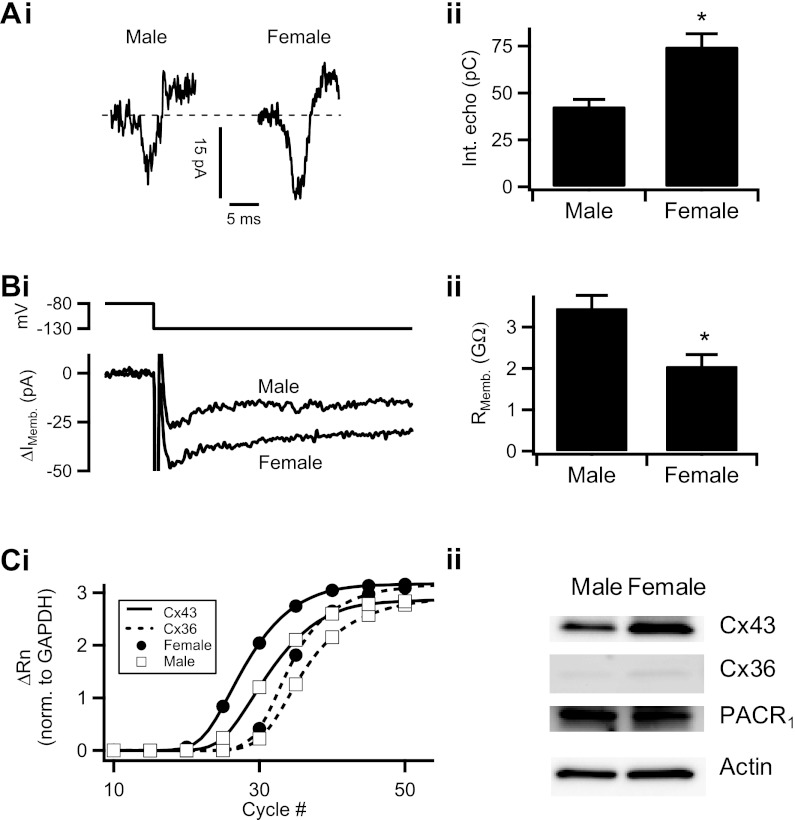
Fig. 3.
Gender dimorphism in electrical coupling. Ai: as in Figs. 1 and 2, electrical echoes were evoked from a voltage-clamped cell and example current echoes from male and female mice are shown. Aii: protocol was repeated in male mouse chromaffin cells (n = 69 echoes) and female mouse chromaffin cells (n = 96 echoes). AP echo sizes were quantified by integration as in Fig. 2. Data were pooled and plotted as means ± SE (*statistical significance at P = 0.0003). Bi: in male and female mouse chromaffin cells, input resistance was calculated following the procedure in Fig. 2Ci. Representative traces of resulting evoked membrane currents are shown. Bii: this protocol was repeated in 15 cells from male mice and 27 cells from female mice. Pooled input resistance values are presented as mean ± SE (*statistical significance at P = 0.003). Ci: real-time quantitative PCR was performed for connexin-43 (Cx43; solid line) and connexin-36 (dotted line) in male (☐) and female mice (●). Representative amplification curves were normalized to GAPDH and plotted. Rn, normalized reporter dye fluorescence. Cii: Western blot analysis of Cx43, Cx36, and pituitary adenylate cyclase-activating peptide (PACAP) receptor (PACR1) in the male and female mouse adrenal medulla. β-Actin or β-tubulin was used as a loading control. A representative blot from one experiment is presented in Cii, with averaged actin or tubulin-normalized gene expression ratios from multiple experiments presented in Table 2.

